


Noticeable jump in ready-for-sale propane inventories
Trader’s Corner, a weekly partnership with Cost Management Solutions, analyzes propane supply and pricing trends. This week, Mark Rachal, director of research and publications, analyzes the recent increase in ready-for-sale propane inventories.
Catch up on last week’s Trader’s Corner here: Geopolitics send crude and propane prices higher
On July 15, the Energy Information Administration (EIA) reported on the data it had collected for the week ending July 10. For that week, it said that U.S. propane inventories increased 3.028 million barrels. That was good news since the build followed a surprise draw of 845,000 barrels during the week that ended July 3.
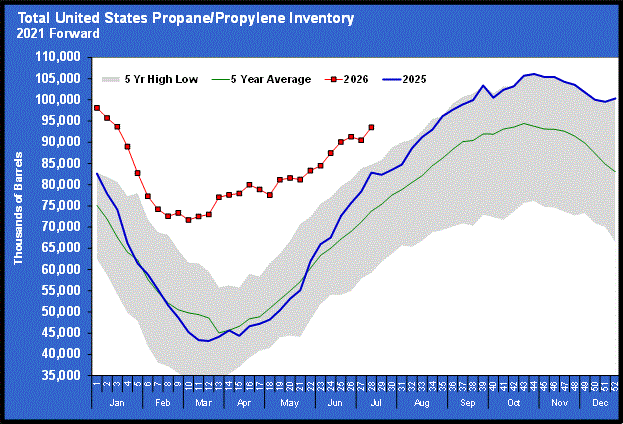
Draws on propane inventories during this time of year are not normal, though one did occur about this time last year. As a general note on inventories, we can see that much of the huge surplus of inventory that existed before the U.S.-Iran war began is getting squeezed. Though still historically high for this time of year, inventory is still getting closer to last year’s level and could very well be around there by the start of winter. The resumption of fighting between the United States and Iran that has all but closed the Strait of Hormuz again increases the chances of that possibility.
That said, there was something that stood out about this inventory build that is the focus of this Trader’s Corner. Ready-for-sale (RFS) propane inventories increased more than the overall inventory. RFS inventory increased 3.921 million barrels. We thought that RFS inventories increasing more than inventories overall provided us a good chance to revisit the change in propane inventory reporting that took place in February 2024.
Prior to that date, the EIA reported only one inventory number. It was combined propane in all caverns at the hubs. At the propane hubs like Mont Belvieu and Conway, there are multiple storage caverns and fractionators. Upstream of the fractionators, the caverns hold natural gas liquids that are mixed and aren’t marketable in that form. This mix is called Y-grade. Storage operators estimate the amount of propane in the Y-grade based on tests that provided them with the percentage of each natural gas liquid.
Downstream of the fractionators are caverns that hold the various natural gas liquids. Some caverns hold propane, others butane, others ethane and so on. Prior to February 2024, the operators would combine the propane in all caverns and send the number to the EIA. But now they send two separate numbers. One for the finished or spec propane and one for the propane that remains in Y-grade.
The propane that is already fractionated and ready for sale is more important in determining the industry’s position to handle prompt demand. Since the RFS inventory number is relatively new, it will take a few years to have enough data to know whether the current position is high, low or normal. As it stands, we only have about 124 weeks of data, but it’s enough to know how RFS stands year-over-year.
First, let’s look at how current RFS inventories compare to where they were at this point in 2024 and 2025.
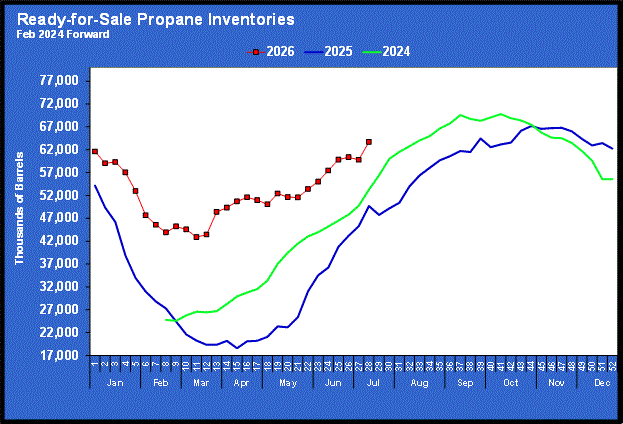
Currently, RFS inventory is 63.710 million barrels. It was at 49.672 million barrels at this point last year and 53.262 million barrels at this point in 2024. The next chart shows both fractionated (RFS) and non-fractionated (Y-grade) inventories and what percentage of the combined inventory is fractionated.
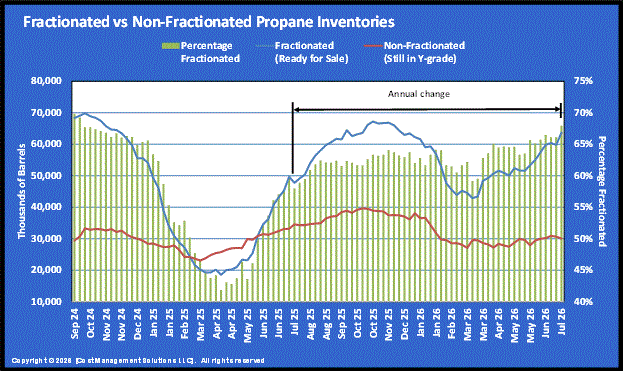
Also, the black line makes it easier to compare current RFS inventories to last year. Currently, RFS inventory is 67.9 percent of total inventories. At this point last year, it was 60 percent. Inventories overall are higher, too. That puts RFS inventories 14.038 million barrels higher than this time last year.
Note how the amount of propane that is unfractionated is relatively stable compared to the amount that is fractionated. In the winter, the fractionated or RFS inventories go down as demand exceeds the rate at which fractionators can process the Y-grade. The winter of 2024-2025 put a lot more pressure on RFS inventories than this past winter. In April 2025, RFS inventories fell to 18.586 million barrels. Higher production and reflectively flat year-over-year demand in the winter of 2025-26 put the low RFS inventory position at 42.328 million barrels.
That provided a very comfortable position to start building for this coming winter. But note that even though RFS inventories have been building since that point, it is a much shallower trend line than the growth after the 2025 low. That is directly related to higher demand from foreign buyers since the war between the United States and Iran began.
Unfortunately, with the fighting resumed, this trend is likely to continue. At this point, the trend is not the propane buyer’s friend. Propane prices are still very good relative to other energy sources and from a historical context. But one can’t help but wonder what might have been had the war not occurred. Our guess is crude would have been around $60 (perhaps lower) and propane somewhere around 35 percent of crude’s value. That is about 50-cent propane.
Economic and especially geopolitical events are always the wildcards that can change the fundamental situation significantly and quickly. When propane fundamentals point to lower prices, as they did before the U.S.-Iran war, it is prudent for buyers to do less hedging and buy more of their supply at market prices. But that doesn’t mean that a lower level of hedging doesn’t have its place under those circumstances.
As we have seen this year, geopolitical developments can still make some level of price protection prudent. Under those circumstances, we hope we get the opportunity to regret that we have price protection at all. That would mean the wildcards did not come into play and buyers are getting the lion’s share of their supply at very low market prices.
Charts courtesy of Cost Management Solutions.
To subscribe to LP Gas’ weekly Trader’s Corner e-newsletter, click here.
You May Also Like
-
Propane price spreads encourage exports
Oct 19, 2026 -

Faces & Places: October 2026
Oct 19, 2026


About the Author: Chris Markham
Chris Markham is the managing editor of LP Gas Magazine. Contact him at cmarkham@northcoastmedia.net or 216-363-7920.


Subscribe to LP Gas
If you enjoyed this article, subscribe to LP Gas to receive more articles just like it.