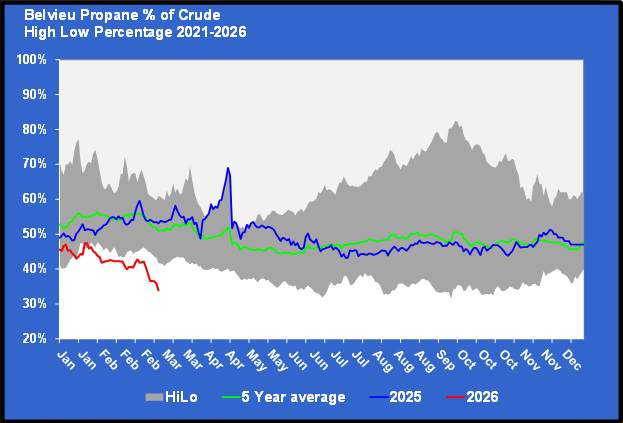
US crude position in the second month of the US-Iran war
Trader’s Corner, a weekly partnership with Cost Management Solutions, analyzes propane supply and pricing trends. This week, Mark Rachal, director of research and publications, looks at U.S. crude prices as the conflict between the United States and Iran continues.
Catch up on last week’s Trader’s Corner here: Overseas markets lift US propane prices
The war between the United States and Iran has been underway for a little over a month now.
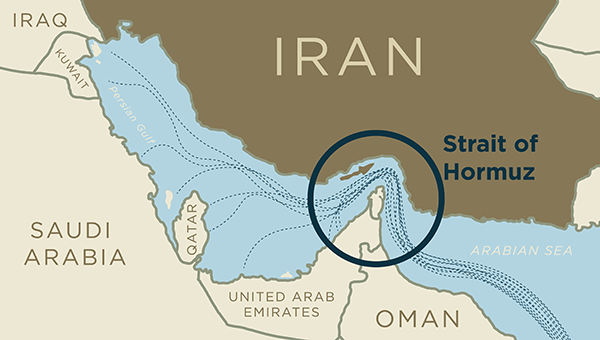
Operation Epic Fury began on Feb. 28. During that time, it has been too risky for most ships to pass through the Strait of Hormuz. Normally, about 20 million barrels per day (bpd) of the world’s crude supply goes through the strait. While adjustments have been made and some ships have been allowed to pass, there is still about a 15-million-bpd impact on global crude supplies.
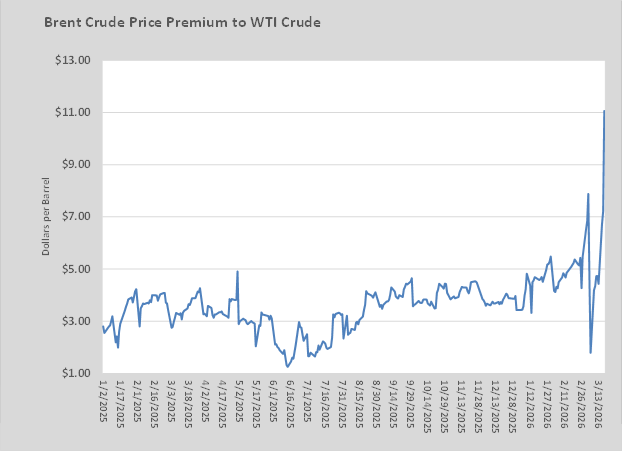
The tightness has caused global crude prices to surge. The price of WTI crude was around $60 per barrel before the war, and it is now around $100 per barrel. The price of Brent crude, a global benchmark, has increased even more.
Analysts are saying even if the war ended today, it would take months, and some say years, for global inventories to recover. Since there is no indication that the war is near its end, the recovery time is extending with each passing day. Much of Europe and Asia is dependent on crude from the Middle East.
As the war enters its second month, we wanted to look at the crude situation in the United States in some detail.
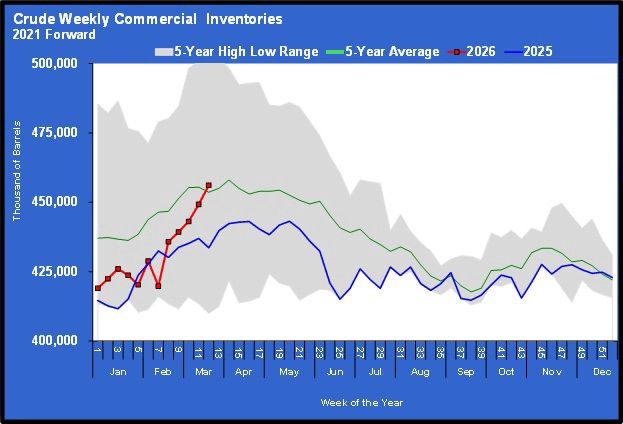
U.S. inventories of crude held by commercial entities in the United States have been rising rapidly during the war. It has been rare for inventories to be above the five-year average level recently, but with last week’s build, they are now over that mark.
The amount of crude owned and held by the government in the strategic reserve is well below capacity.
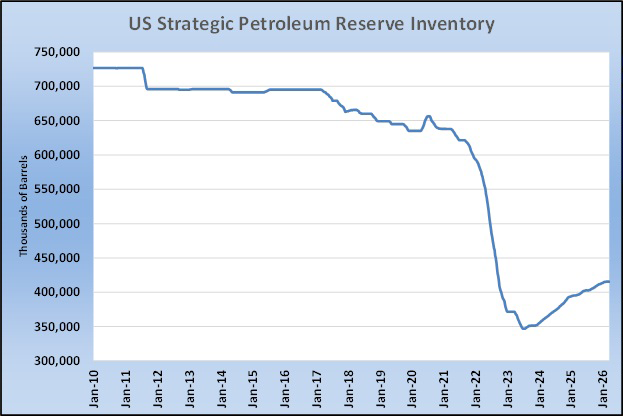
There are more than 700 million barrels of capacity in the reserve, but much of it was used during the Joe Biden administration to soften the blow of higher crude prices following Russia’s invasion of Ukraine. The reserve has been slowly recovering since Donald Trump became president.
The United States has announced it will make 172 million barrels available from the reserve due to disruptions in supply caused by the U.S.-Iran war. However, any oil company/refiner that takes crude from the reserve must return it with an 18 to 22 percent charge to be paid in crude. In other words, those taking crude from the reserve will have to return more than they take out. They will have a couple of years to return the barrels. It is estimated that if the entire 172 million barrels are taken, 200 million will be returned due to the surcharge.
Cushing, Oklahoma, is the U.S. trading hub for crude. Therefore, the status of inventories at that hub has an oversized impact on U.S. crude pricing.
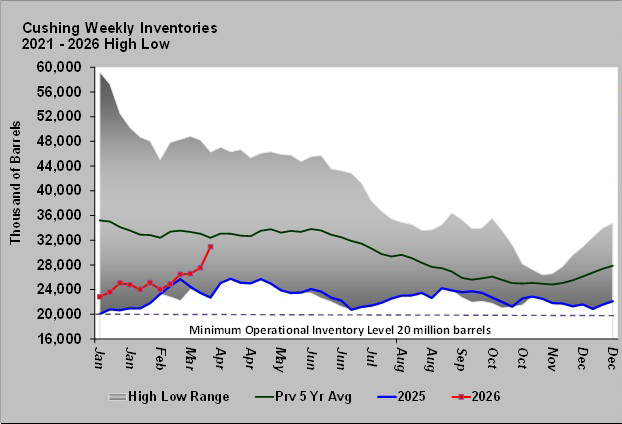
Cushing inventories remain well below their long-term levels, but they have been improving lately. That helps reduce the upward price pressure on WTI. Before the war, WTI was trading at less than $4 per barrel below Brent crude. On March 27, WTI was trading $13 per barrel below Brent crude.
With this backdrop in U.S. inventory positions, we will take a closer look at the U.S. crude supply and demand balance in next week’s Trader’s Corner.
Charts courtesy of Cost Management Solutions.
To subscribe to LP Gas’ weekly Trader’s Corner e-newsletter, click here.
You May Also Like
-
Overseas markets lift US propane prices
Mar 23, 2026 -
Closing of Strait of Hormuz impacts energy exports
Mar 16, 2026 -
Impacts of US-Iran conflict on propane market
Mar 9, 2026


Subscribe to LP Gas
If you enjoyed this article, subscribe to LP Gas to receive more articles just like it.