Record-high propane exports are a potential game changer
Trader’s Corner, a weekly partnership with Cost Management Solutions (CMS), analyzes propane supply and pricing trends. This week, Mark Rachal, director of research and publications, examines the landscape of propane exports and what the current record-high numbers could mean for the future.
Catch up on last week’s Trader’s Corner here: Global LPG supply flows change dramatically
For the week ending May 22, the Energy Information Administration (EIA) reported that U.S. propane exports surged 624,000 barrels per day (bpd) to a record high of 2.625 million bpd, which was 290,000 bpd higher than the previous record.
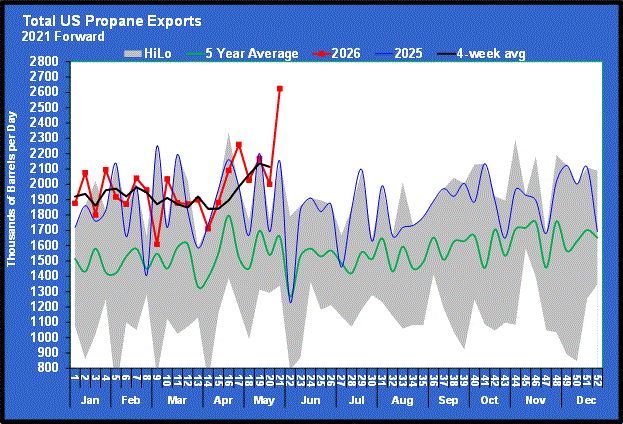
At the same time, it reported that US domestic demand tumbled 498,000 bpd to 510,000 bpd.
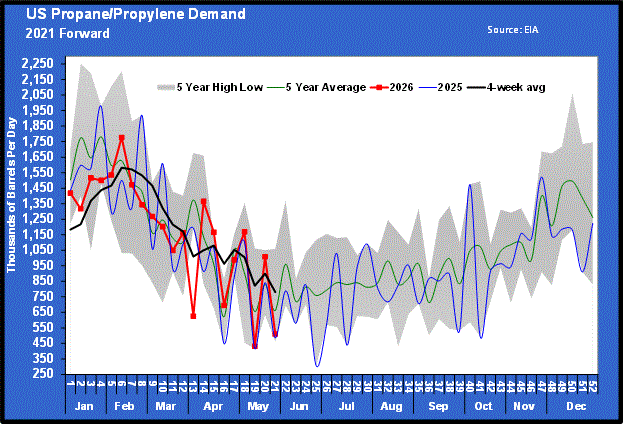
We do not believe either of those changes occurred. First, look at the weekly volatility in domestic demand (red line) in chart two. We don’t think U.S. domestic demand changes that much from one week to the next. That is why we tune out the weekly changes and focus on the four-week average (black line). Normally, that wouldn’t be a problem.
But here is the problem right now. The industry knows that export demand is changing, and it needs an accurate gauge of just how much. We are trying to figure out sustainable export rates. We need to know how much pressure will be on propane inventories if the U.S.-Iran war continues. Seeing an export number that appears well beyond capacity, even if new capacity is online (which it may not be) and flex capacity has switched from ethane to propane (which might not be the case), makes it very hard to determine the potential stress on propane supplies.
We believe that one of the problems with accuracy in the export rate is how large export cargoes can be. Very Large Gas Carriers have a capacity of 440,000 to 629,000 barrels. If the timing is off on reporting just a few cargoes to the EIA, it can cause extreme volatility week to week. Since domestic demand is calculated, if exports are overstated one week, domestic demand tumbles and vice versa.
It is worth noting that, as we write on May 29, a 60-day ceasefire agreement between the United States and Iran is awaiting President Donald Trump’s approval. If he approves the agreement, the Strait of Hormuz is expected to open immediately, with normal shipping rates resuming in about 30 days. It will take some time for liquefied petroleum gas supplies, including propane, to return to normal. Thus, demand for U.S. propane is likely to remain elevated for a while even if the Strait of Hormuz opens.
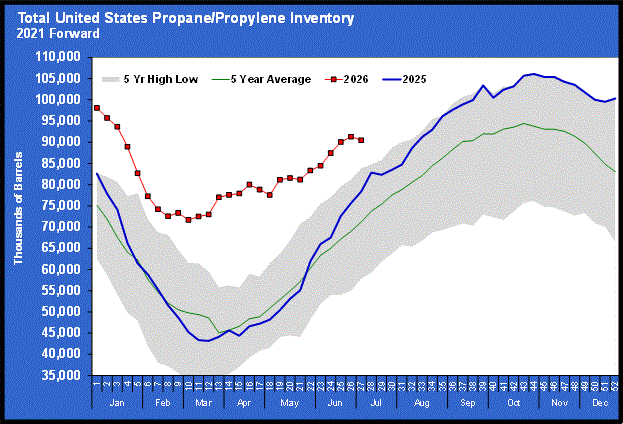
The propane pricing environment is going to be considerably higher this winter than it would have been without the war in the best-case scenario. However, if the deal falls through, the inventory trend is now pointing below the five-year average.
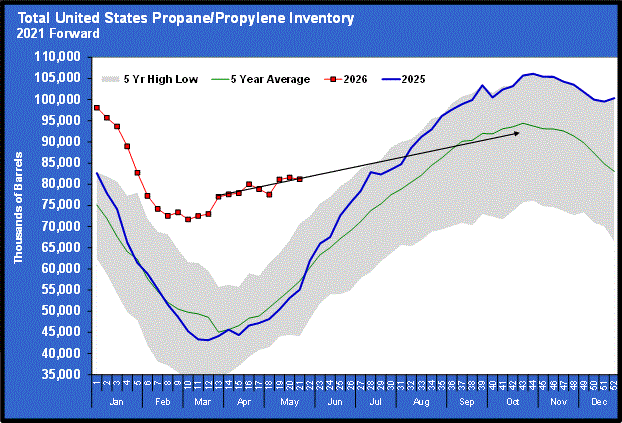
This is an incredible change of circumstances, given that before the war, start-of-winter inventory would have likely exceeded last year’s 106-million-barrel record.
Regardless of where the demand is occurring, the U.S. domestic market is headed towards a tighter supply-demand balance that will support a higher pricing environment. We can take out some of the noise of the extreme weekly volatility in the weekly domestic demand versus export demand difference by looking at the combined supply and demand.
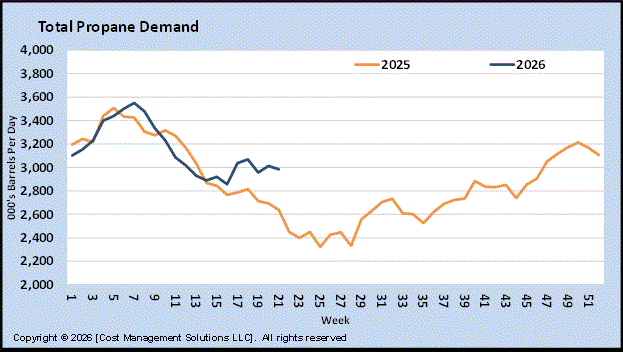
Demand in 2025 was more typical, with a summer dip in overall demand allowing inventories to be replenished at a fast rate. This year, total demand is charting an entirely new course.
Let’s look at total supply compared to this new high demand number to see just how tight the supply-demand balance remains.
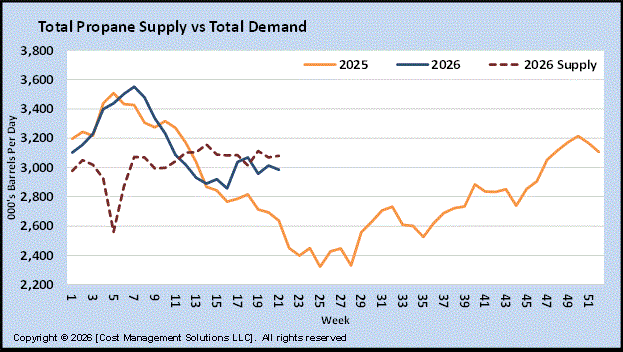
Note the V-shaped dip in supply. That was caused by the winter storm that resulted in disruptions to production as well as increasing demand. Beyond that, you can see that the combination of propane imports and domestic production is steady.
In the propane world, supply is largely inelastic. It is the variation in demand that determines the course of inventory accumulation. Note that somewhere around the 12th week of the year (the end of March), total demand falls below total supply (imports plus production). Demand usually continues to fall through mid-summer before picking up again.
If you assume the supply line remains relatively flat, the gap between supply and demand becomes quite large, allowing large builds in inventory. But this year’s demand is much closer to the supply line.
This past week’s export numbers would have the market believing that there will be no inventory accumulation. But if we use the four-week averages to take out some of the volatility noise, supply is still exceeding demand, albeit only marginally.
To be sure, the situation has certainly gone against propane buyers and consumers over the last few months, but it is not nearly as dire as the reported 2.625-million-barrel export rate would suggest.
Propane prices were separating from crude, going higher at the end of the week as crude moved lower. Propane is still valued low relative to crude, so a reset in propane’s relative valuation against crude is justified. Thankfully, the revaluation remains controlled. The market has not panicked despite the astronomical increase in exports that was reported.
If last week’s export rate is anywhere near a new normal, propane prices are going to go extremely high, as that is the only mechanism to slow export demand and hopefully conserve supplies that will be needed at home this winter.
Otherwise, buyers must hope propane supplied from the Middle East will be restored soon. In that case, they can simply prepare for a moderately higher, more normal pricing environment this winter rather than Armageddon.
Charts courtesy of Cost Management Solutions.
To subscribe to LP Gas’ weekly Trader’s Corner e-newsletter, click here.
You May Also Like
-

Mental health leadership in the propane industry
Jul 17, 2026 -

Rising Leader Rewind: Sarah Knight
Jul 16, 2026 -

Rising Leader Rewind: Josh Kasprzak
Jul 15, 2026 -
Geopolitics send crude and propane prices higher
Jul 13, 2026

Subscribe to LP Gas
If you enjoyed this article, subscribe to LP Gas to receive more articles just like it.