New EIA data illustrates role rail plays in propane shipments
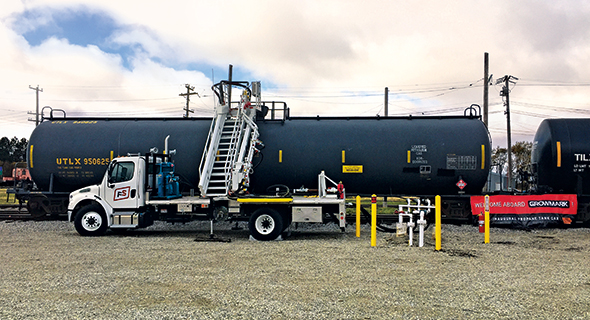
New propane rail terminals such as this Growmark site at Progressive Rail’s Iowa Traction Railway yard in Mason City, Iowa, have supported the growth of propane rail shipments. Photo courtesy of Growmark Photo: U.S. Energy Information Administration
Although most of the propane produced in the United States is still shipped by pipeline, an analysis of new U.S. Energy Information Administration (EIA) data shows just how reliant the industry has become on rail to move product.
Based on EIA data, propane movements by rail more than doubled between 2010 and late 2016. In fact, propane rail movements increased from 106,000 barrels per day (bpd) near the start of the period to 244,000 bpd by the end of it.
EIA tracks propane as one of four hydrocarbon gas liquids (HGLs) that move by rail. The agency also tracks propylene, normal butane and isobutane, but propane makes up the majority of HGL rail movements, the agency says.
In 2016, 426,000 bpd of HGLs moved by rail between January and November. By comparison, rail movements of ethanol and crude oil averaged 637,000 bpd and 478,000 bpd, respectively, during the same period.
“Now that crude oil has come down [in price], [HGLs] are coming very close to crude oil by rail data numbers,” says Warren Wilczewski, an industry economist at EIA, in a February webinar.
But without propane, HGL shipments by rail would not rival crude oil shipments by rail. Wilczewski largely attributes the jump in propane rail shipments to increases in production. Specifically, he cites the Marcellus and Bakken shale plays as key starting points for the movement of propane by rail.
“For those who seek to deliver propane to retail distributors in New England, in the Florida Panhandle or in places where the Cochin Pipeline used to deliver propane, rail is now one of the only viable options,” Wilczewski says.
Propane rail movements by PADD
An analysis of propane rail movements by Petroleum Administration for Defense District (PADD) offers some interesting takeaways, as well – particularly in PADDs 1 (East Coast), 2 (Midwest) and 3 (Gulf Coast).
Propane rail movements originating in PADD 1 were up eightfold between 2010 and 2016, according to EIA data. During that span, PADD 1 propane rail movements piqued in July 2015, with monthly receipts reaching 2.75 million barrels. Propane rail shipments in July 2015 were up nearly 2 million barrels from the previous July, and PADD 1 receipts averaged 1.93 million barrels per month from July 2015 to November 2016.
An analysis of EIA data also shows that 58.4 percent of the propane originating in PADD 1 that moved by rail stayed in PADD 1 between January 2010 and November 2016. Still, 30.1 percent was railed from PADD 1 to PADD 3 over that period.
The pace of PADD 1-to-PADD 3 rail shipments spiked starting in April 2015. Between that month and November 2016, 39.5 percent of all railed propane in PADD 1 went to PADD 3.
“PADD 1 serves as an excellent example of what has been happening in the market,” Wilczewski says. “The production of hydrocarbon gas liquids, especially natural gas liquids, has really taken off in PADD 1 in the Appalachian region – in the western counties of Pennsylvania and in West Virginia.”
An analysis of PADD 2 between 2010 and 2016 also reveals a number of findings on propane movements by rail. Propane rail movements were relatively steady between 2010 and the third quarter of 2013, but they jumped nearly 25 percent from October 2013 to November 2013.
That November, which marked the beginning of a “perfect storm” of propane demand related to crop drying and winter heating, 2.02 million barrels of propane originating in PADD 2 moved by rail.
The Midwest has been moving propane like no other region since November 2013. PADD 2 produced at least 2 million barrels for rail transport in 30 of 37 months from November 2013 to November 2016. Also since November 2013, an average of 2.52 million barrels that shipped per month via rail originated in PADD 2.
In addition, the distribution of PADD 2 barrels is greater than PADD 1’s. Like PADD 1, most PADD 2 barrels that move by rail remain in the PADD. But PADDs 1 and 3 have been taking on more PADD 2 propane by rail in recent years.
PADD 1 has received more propane via rail from PADD 2 in the last three years (21.8 million barrels) than it did in the previous four (20.5 million). PADD 3 has been just as reliant on PADD 2 propane via rail, also receiving more over the last three years (26.2 million barrels) than it did over the previous four (25.7 million barrels).
“PADDs 2 and 3 stand out,” Wilczewski says. “You have a fairly balanced market if you now include rail in PADD 2. Combine pipeline takeaway with [added] rail [shipments] in 2016, and suddenly both pipeline and rail are shipping product out [of PADD 2]. PADD 3 has become a significant recipient from throughout the country by both rail and pipe.”
You May Also Like
-
Appeals court upholds New York gas ban
Jul 1, 2026


About the Author: Kevin Yanik
Kevin Yanik was a senior editor at LP Gas Magazine.
Subscribe to LP Gas
If you enjoyed this article, subscribe to LP Gas to receive more articles just like it.