Propane exported to other PADD regions, stock watch
Each month, ICF provides LP Gas with updates on the U.S. propane market, as well as the latest trends. The data for February 2019 focuses on propane exported to other Petroleum Administration for Defense District (PADD) regions.
Stock information for AmeriGas, Ferrellgas and Suburban Propane also is provided.
These charts show the amount of propane moving from the respective PADD region to other PADD regions by pipeline, barge or rail:
Total U.S. Propane Exported to Other PADD Regions (Million Gallons)
| U.S. Total | PADD 1 | PADD 2 | PADD 3 | PADD 4 | PADD 5 | |
|---|---|---|---|---|---|---|
| 2016 | 9,579 | 190 | 5,483 | 1,265 | 2,641 | 0 |
| 2017 | 10,516 | 528 | 6,024 | 1,196 | 2,768 | 0 |
| Last 12 months | 8,201 | 413 | 4,645 | 896 | 2,246 | 0 |
Share of U.S. Propane Exported to Other PADD Regions (Percent)
| U.S. Total | PADD 1 | PADD 2 | PADD 3 | PADD 4 | PADD 5 | |
|---|---|---|---|---|---|---|
| 2016 | 36% | 8% | 86% | 8% | 125% | 0% |
| 2017 | 38% | 19% | 92% | 8% | 128% | 0% |
| Last 12 months | 36% | 19% | 87% | 7% | 130% | 0% |
STOCK WATCH
| Company | 12-month chart (as of December ’18) | Price (12/18/18) | Current Yield | 52-Week Low | 52-Week High | YTD Price Performance |
|---|---|---|---|---|---|---|
| AmeriGas – APU | $29.69 | 13.0% | $22.75 | $448.37 | 17.4% | |
| Ferrellgas – FGP | 1.10 | 0.0% | 0.53 | 4.33 | 105.6% | |
| Suburban Propane – SPH | 22.47 | 10.8% | 18.63 | 25.93 | 16.6% |
Source: Company data, FactSet and Wells Fargo Securities LLC
(Featured image: iStock.com/MicroStockHub)
You May Also Like
-
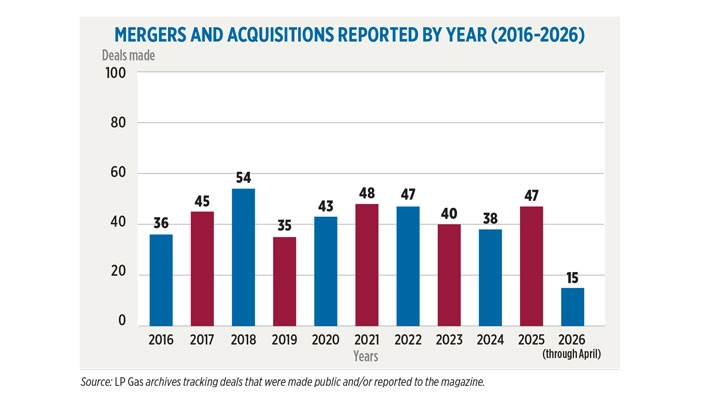
Propane Market Metrics: A decade of propane deals
May 24, 2026

Subscribe to LP Gas
If you enjoyed this article, subscribe to LP Gas to receive more articles just like it.