If your questions aren’t answered below, please visit our customer service FAQ page here.
Not a subscriber? Sign up for our magazine.
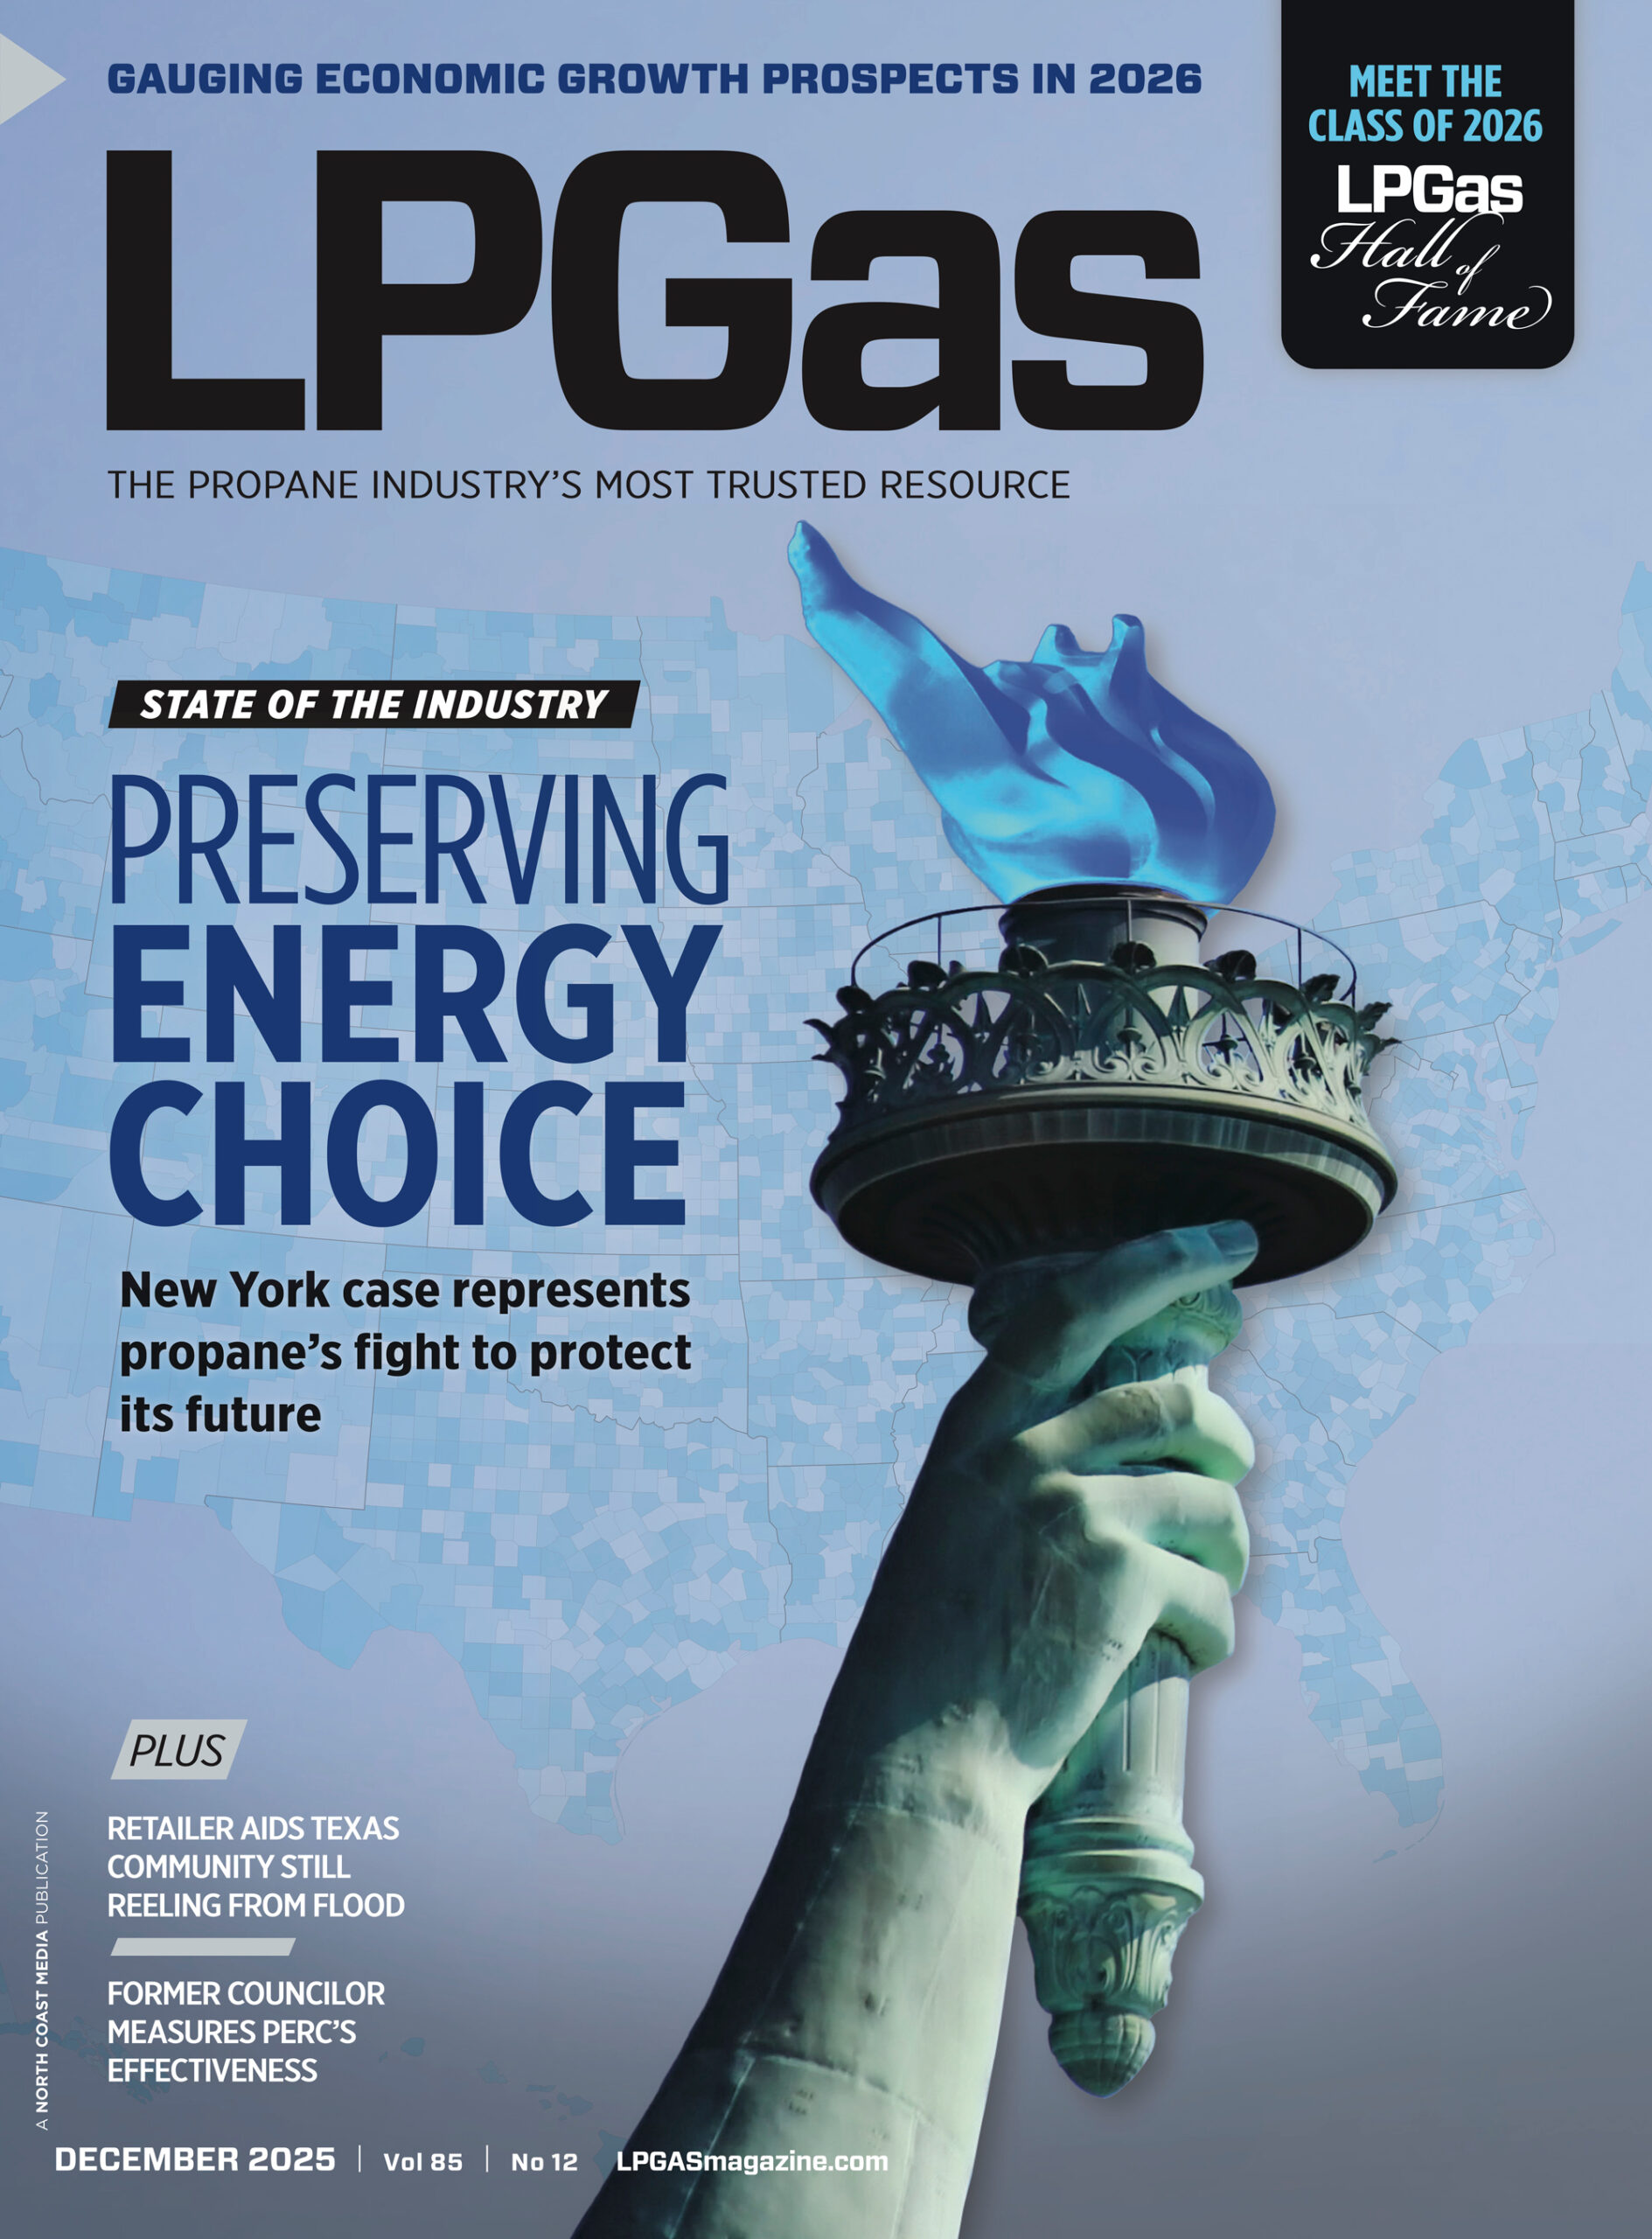
LP Gas magazine is available in two formats: print or digital. Choose the version that’s most convenient for you. Digital-only subscriptions are free to all qualified subscribers. If you sign up you will receive the digital edition via e-mail each month. The digital edition is reader friendly for computer, tablet and smartphone and is where you’ll see our magazine first each month. We also offer free print magazine subscriptions to qualified U.S. and Canadian residents. If you are an International resident seeking a print subscription, click here to see rates and purchase a subscription.
Subscription Rates for Print and Digital Editions:
U.S. Canada/Mexico: $41.95 for 1 year; $57 for 2 years:
All other countries: $134.95 for 1 year, $199.95 for 2 years
If you are an International resident seeking a print subscription, click here to purchase a subscription.
Already a subscriber? Renew/update your subscription.
Visit LP Gas’ Subscriber Services to renew/validate your subscription, change your address or update your preferences.
Looking for news in your inbox? Sign up for e-mail newsletters.
LP Gas offers several free eNewsletters. Sign up today and you’ll be receiving our emails tomorrow!
- Blue Flame Pilot is a monthly eNewsletter that brings in-depth feature stories, web exclusives, opinion pieces and the latest news — from our editors and other industry voices — to thousands of digital subscribers every other Thursday.
- Trader’s Corner (formerly Propane Price Insider) is a weekly eNewsletter that, through an arrangement with Cost Management Solutions, focuses on the analysis of the energy markets for the propane marketplace.
Need more help? Contact customer service.
If you have questions about your subscription, please contact our customer service department:
LP Gas
P.O. Box 20
Lincolnshire, IL 60069
lpgas@omeda.com
Voice: 847-513-6030
Fax: 847-763-9694
Antoinette Sanchez-Perkins, Senior Audience Development Manager
asanchez-perkins@northcoastmedia.net
Voice: 216-706-3750
Fax: 702-586-2790
Hillary Blaser, Audience Marketing Manager
hblaser@northcoastmedia.net
216-440-0411
Are you an advertiser? Meet our sales team.
If you’re interested in advertising in print or online, you can contact our sales team now.


