How do your business standards stack up?
Everyone wants to know the industry standard for gallons delivered per bobtail, gallons per employee, customers per bobtail, driver compensation per mile and any other statistics they can get their hands on.
The only available public data involves multi-state retailers. LP Gas Magazine completes a Top 50 Retailers section each February detailing operating data for all companies contributing to the edition. Propane Resources combines and adjusts that data to prepare a handful of “operating standards” for a quarterly newsletter we publish. The data for 2000 is listed in the chart on page 7.
Do you agree with these numbers? Are there anomalies?
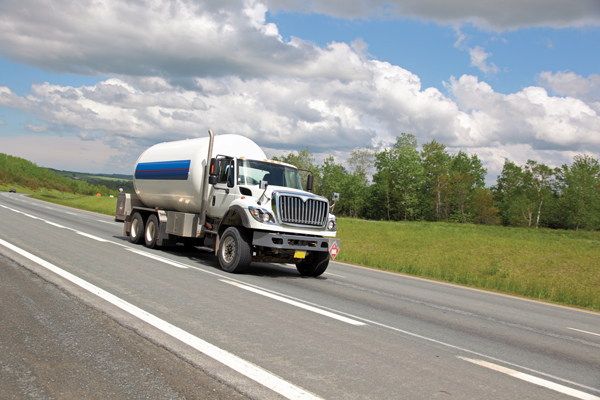
One number that bothers me is the gallons per bobtail. My assumption is the number of bobtails given for the compilation included spare bobtails, thus deflating the actual gallons delivered per bobtail. A standard we like to use is 500,000 gallons per truck (of course this number is dependent on geography and tank size). Remember, there is basically no time difference in dropping 150 gallons or 300 gallons. The major time is driving to a customer’s location and running the hose to the tank.
What are your numbers? Are they in an acceptable range? If low, why? Know your numbers.
In addition to the table, what other comparisons should be figured for your company? While there are several, here are some we recommend every retail propane marketer know:
- Percent of customers on keep full plan
- Driver compensation per mile driven
- Gallons delivered per mile driven
- Deliveries per bobtail per day
Each category listed affects delivery efficiency and the amount of cash in your back pocket.
Another non-operational item to watch is accounts receivable. What is your percent of A/R over 60 days? Somewhat similar is DSO (daily sales outstanding – how many days it takes to collect payment once a delivery has been made). This data will give a good indication of what type customer base you have.
Let’s discuss driver compensation in more detail.
LPG Central, seller of remote tank monitoring devices, uses $2.15 per mile as an average delivery cost per mile driven in their economics. This includes wages, fuel, maintenance, insurance and depreciation. Assuming 20,000 miles per truck and 500,000 gallons annually, this equates to 8.6 cpg.
Using the Total Average from the above chart, the total cost is 12.3 cpg. This does not include back office support, only driver costs associated with delivering a gallon of propane. Run your own economics to determine your numbers.
Daily deliveries per bobtail can be quite different for a company selling to mostly farmers versus a southeast retailer delivering to 120-gallon tanks, but retailers can gauge how efficient they are. Various operations personnel like to deliver approximately two bobtails per day. Many companies purchase a “spare” bobtail that is used as an operating vehicle in the winter rather than used when another vehicle needs repair. Study your operational needs – could a better routing and scheduling system help relieve the need for that “spare”?
Ratios are a great way to compare yourself against the industry, but don’t get too caught up in the numbers. Every retail propane business is different.
Study your operation on its own two feet. What changes can you make to take better care of the customer, while at the same time, make your job easier and more profitable?
Cutting expenses for the short-term is easy. What can you do to help the long-term?


