The highs and lows of price protection
Trader’s Corner, a weekly partnership with Cost Management Solutions, analyzes propane supply and pricing trends. This week, Mark Rachal, director of research and publications, examines price parameters to better understand the risks and advantages of price protection.
Catch up on last week’s Trader’s Corner here: Dealing with propane demand volatility
In today’s Trader’s Corner, we are going to look at price parameters to help us better understand the risks and advantages of price protection.
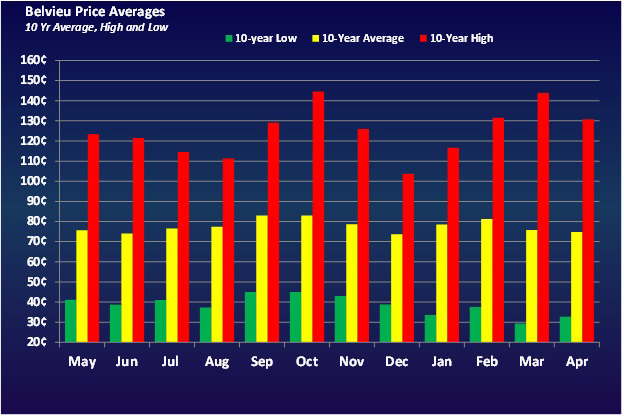
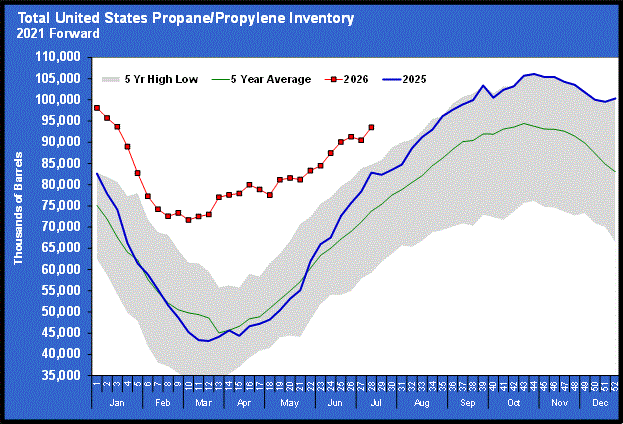
Chart 1 plots the high, low and average price of propane for each month of the year over the last 10 years. As we have said in the past, we consider the 10-year price average a good guideline for when propane’s value is good for buying price protection. The five-year price average is a little elevated right now due to the influence of the Ukraine-Russia war. The 10-year average lowers the average and makes buys at or below that average more likely to work for the buyer.
We set up the chart from May to April rather than a calendar year, so it better represents the buy and sell season of a propane retailer.
As we do this analysis, we are going to assume the retailer buys every gallon of price protection right at the 10-year average for each of the months. Of course, buying risk would be reduced if the retailer were able to buy below the average, and it would increase if price protection is set at a price above the average.
Before going forward, it is important to understand that this is a backward-looking view of what has happened in the past. The past is never an indication of what will happen in the future. With that said, someone evaluating risks and opportunities must start somewhere, and the past at least provides context and parameters to consider.
Look at Chart 1 in this way: In the past, a buyer of price protection at the top of the yellow bar (10-year price average) could have potentially protected against an increase in price above that point and to as high as the top of the red bar (10-year high for that month). However, the buyer would assume the downside risk from the top of the yellow bar to the top of the green bar (10-year low for that month).
We have created two tables that will allow us to better analyze what this chart is showing. We have divided the tables into two sections to better fit our format.
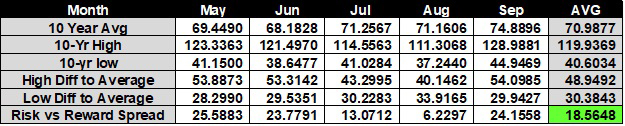
Table 1 covers the months that would be the traditional accumulation period for propane buyers. This period is when price protection would generally be bought for the winter months, but retailers might be less concerned about price protection for these months. Pulling these months out allows us to focus more closely on the months propane retailers would most likely want to own price protection, which are October through April.
Let’s use the month of May to get familiar with the table. The 10-year price average for that month is 69.4490 cents. A buyer using the 10-year average for guidance would do their best to buy May price protection at or below this 10-year average.
The high is what the buyer is protecting against and represents the highest reward a buyer of price protection at the 10-year average would have gotten during the last 10 years. In the case of May, the 10-year high monthly average was 123.3363 cents, meaning the reward that year would have been 53.8873 cents for price protection bought at the 10-year average for May.
On the flip side, when price protection is bought at the 10-year average, the buyer takes the risk that prices will be lower than that average. The 10-year low for May was 41.1500 cents. A buyer getting price protection at the 10-year average that year would have locked supply costs 28.2990 cents higher than the actual month average.
In the case of May, owning price protection in the year that prices went the highest provided a reward that was 25.5883 cents more than the penalty for owning price protection in the year the monthly average was the lowest during the last 10 years. We call that the “risk versus reward spread.” In the May-through-August period, the spread is positive for the buyer with an average positive of 18.5648 cents.
Now let’s focus on the months that most propane retailers are most interested in owning price protection. These are the months when the bulk of their annual sales volume will come.
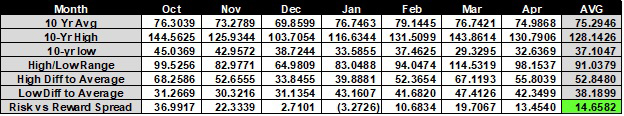
The explanation concerning the numbers for May applies to each of these months, so there is no use in repeating our math from earlier. Instead, let’s focus on how the numbers might guide our decisions. October has the highest risk/reward spread. Based on history, it is a month that a buyer might be the most aggressive in obtaining price protection.
On the other hand, the risk/reward number for January is negative. That doesn’t mean we wouldn’t want price protection for that month because there was still a 39.8881-cent difference between the average and the high. But we would perhaps buy less price protection volume for that month. Or, perhaps better, make that a month to look for opportunities to buy price protection below the average and be aggressive should such an opportunity occur. Conversely, we would want to be cautious about buying price protection above the average for January.
With the upside reward and downside risk over the past 10 years quantified, indulge us in making our market psychology speech once again. It is not hard to imagine the positives of having price protection at the 10-year average when prices blow out to the upside. During those months and years, our valued customers are going to get some expensive propane bills. Any price protection a retailer has in his pocket that can lower the cost to the consumer will help toward preserving that valued customer. It is in those years that our customer is most likely going to be motivated to look for an alternative supplier.
Let’s say the retailer got price protection on 50 percent of their projected sales volume at the month average of 76.3039 cents, and the rest is bought at a market price of 144.5625 cents. The price for the customer could be built from an average supply price FOB Mont Belvieu of 110.4332 cents.
Competitors that didn’t try and protect their customers from such an event must build their sales price from 144.5625 cents MB. The propane bill the retailer sends the customer based on 110.4332 cents is still going to have shock value to it, and the customer may still shop around. But at least the price protection the retailer provided gives him a fighting chance to look good against the competition and retain the customer.
On the other hand, let’s look at October and think about what it was like the year that propane prices averaged 31.2669 cents. Let’s say the retailer bought price protection on 50 percent of their projected sales volume at the 10-year average of 76.3039 cents. The average supply cost would be 53.7854 cents. Half at the 31.2669-cent market price and half at the 76.3039-cent price protection price. Now let’s assume our competitor bought all his supply at the market at 31.2669 cents. The retailer is certainly at a substantial disadvantage with his supply cost built from the 53.7854-cent base. But we believe strongly that since our customer is likely getting the lowest propane bills in years, their motivation to shop will be greatly reduced.
We can’t deny the disadvantage that the price protection has put the retailer in during the ultra-low pricing environment, but we will argue that the potential for losing the customer is far less than if the retailer hadn’t protected the customers in the blowout years.
Chart and tables courtesy of Cost Management Solutions
To subscribe to LP Gas’ weekly Trader’s Corner e-newsletter, click here.
You May Also Like
-

Faces & Places: July 2026
Jul 24, 2026 -
Aaron Huizenga on the power of self-awareness
Jul 19, 2026

Subscribe to LP Gas
If you enjoyed this article, subscribe to LP Gas to receive more articles just like it.