Draw on propane inventories is a setback for buyers
Trader’s Corner, a weekly partnership with Cost Management Solutions, analyzes propane supply and pricing trends. This week, Mark Rachal, director of research and publications, unravels the unexpected draw on propane inventories this July.
Catch up on last week’s Trader’s Corner here: Patience is paying off in propane price protection
In the previous Trader’s Corner, we discussed how patience was paying off for buyers that had waited to buy this winter’s price protection as the average value for propane from October 2025 to March 2026 was very near the 10-year average winter price for propane. In fact, for a couple days after that Trader’s Corner was written and before the Energy Information Administration (EIA) released its latest Weekly Petroleum Status Report (WPSR) on July 23 for the data collected for the week ending July 18, winter propane became valued at less than its 10-year price average.
Both Mont Belvieu and Conway propane for this coming winter and the two winters that follow were below that important benchmark. That was a great development for propane buyers as it reduces the risk to retailers for establishing a supply price for propane as a means of price protection for customers.
Unfortunately, buyers were in for a nasty surprise when the WPSR was released on July 23. The EIA reported a draw on propane inventories of 522,000 barrels. A draw on inventories in July! Since that report, propane prices have been moving higher again. It pushed the winter price at both Mont Belvieu and Conway back above the 10-year winter price average. That is not good for buyers.
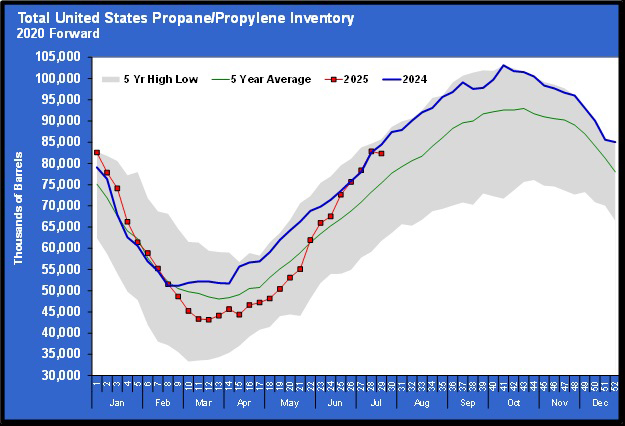
One simply does not expect to see a down leg in propane inventories in the middle of summer. Of course, the market reacted as the market does to such things: by taking prices higher.
Even though I was alone when the WPSR came out and began filling out the data summary and email to send to our daily readers, conversations began to happen. “Surely you typed that number in wrong, moron.” “No, I am telling you, dude, I am looking at the number right here in front me. I typed it right.” “Fat chance, you idiot; inventories never decline in July.”
After calling our therapist to schedule an emergency visit, we (obviously more than one in the room now) began to take a deeper dive into the numbers. The first thing we noticed was a significant week-to-week gyration in East Coast propane inventories.
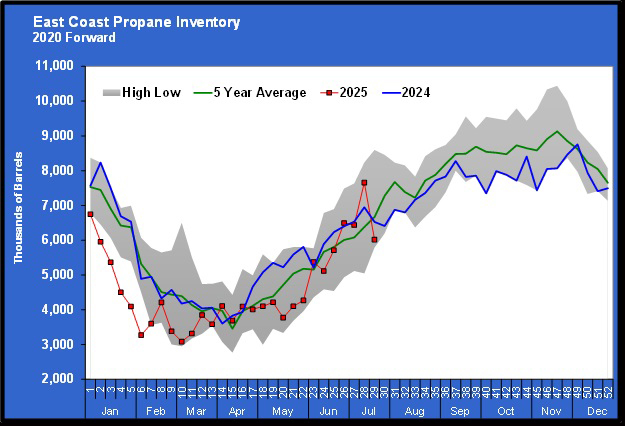
East Coast inventories tend to have wide swings because of the relatively small amount of inventory and the high volume that goes out in each propane export cargo. Still, the inventory swing over a two-week period was extreme, going from nearly a five-year high to near a five-year low.
Then there was the fact that ready-for-sale (RFS) propane inventory went up 4.3 million barrels for the week ending July 11 and then declined 1.9 million barrels for the week ending July 18. So, it made us wonder what the history of RFS inventory changes has been. Remember, RFS inventories only became available in February 2024. The chart below plots week-to-week RFS inventory changes.
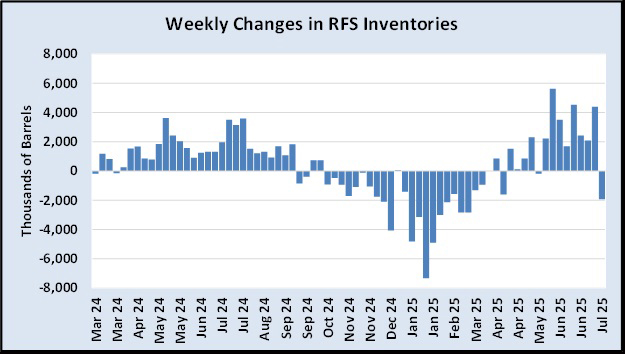
The amount of propane that fractionators process stays somewhat steady throughout the year. Whether RFS inventories are accumulating or declining depends primarily on demand. As one would expect, RFS inventories generally increase in the summer and decline in the winter.
Looking back at last summer, RFS inventories increased every week from April to September. Relative to what we have seen this summer, the week-to-week changes were steady. The weekly changes this summer have been volatile compared to last year.
First, we note that about every three weeks this summer, there have been large RFS inventory builds compared to the largest builds of last year. Then there was this highly abnormal summer inventory draw last week. A draw on RFS inventories of any size never occurred last summer, much less one that was nearly 2 million barrels.
To be perfectly clear, this data may reflect exactly what happened each week with production and demand. But on the surface, one could imagine that there was perhaps an overreporting of RFS inventories on the week of July 11 or even during some of the weeks prior and the error was found and corrected during the week ending July 18. At the very least, one must acknowledge that the draw on RFS inventories of such a large amount in the middle of July looks odd. And further, the large swing in East Coast inventories exceeded its normal volatility. Perhaps the two odd things were related, perhaps not.
“You, trying to be deductive and logical? What a joke.” “No, man, I am telling you it makes sense.” “Shut up, guys, I am trying to write here.” Three in the room now, starting to get crowded.
Regardless of the reasons, the unusual inventory draw contributed to ending a nice downtrend in propane prices that, after much patience, was paying off for propane buyers. Buyers are back in patient mode, hoping the impact of the surprise will wear off soon enough, resulting in propane values for the upcoming winter falling below the 10-winter average once again.
“Well, I am losing my patience. When was the last time you had a bath? It stinks in here.”
Charts courtesy of Cost Management Solutions
To subscribe to LP Gas’ weekly Trader’s Corner e-newsletter, click here.
You May Also Like
-

LPG Spotlight: J.S. West & Cos.
May 29, 2026 -

Propane Personality: Freddie Ridler
May 27, 2026 -
Global LPG supply flows change dramatically
May 26, 2026 -

Mental health: Stories from the propane industry
May 25, 2026

Subscribe to LP Gas
If you enjoyed this article, subscribe to LP Gas to receive more articles just like it.