Comparing current propane market conditions to 2014
Trader’s Corner, a weekly partnership with Cost Management Solutions, analyzes propane supply and pricing trends. This week, Mark Rachal, director of research and publications, addresses propane prices and makes comparisons to conditions in 2014.
As you may recall, we recently put some data together to share on Trader’s Corner to look for ways to anticipate how propane’s price might perform before next winter. We looked at several factors and concluded that it is just not possible to pick one data point – for example, inventories – and use it as a predictor of future pricing. You really have to look at multiple data points and also have some context of what is going on in the marketplace to improve your odds in predicting future pricing.
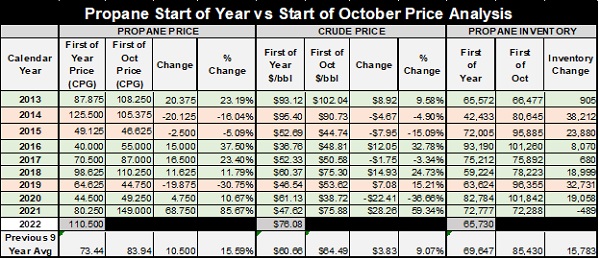
Table 1: Cost Management Solutions
To reinforce the point, we want to begin with focusing on 2014 in Table 1 and then see where prices were in 2015. We are choosing 2014 because it has characteristics that are remarkably similar to this year.
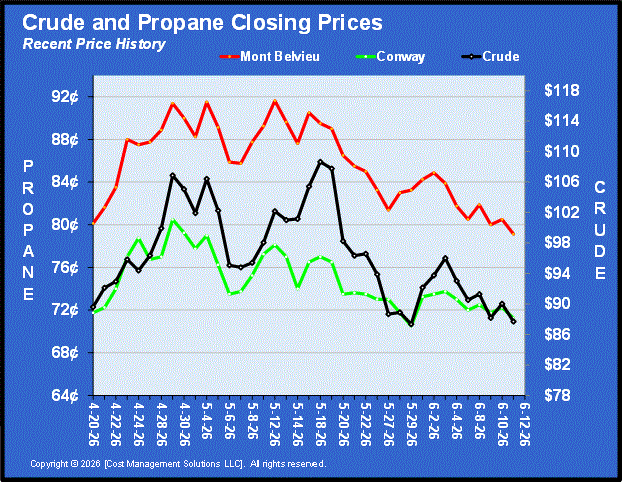
At the beginning of 2014, Mont Belvieu propane was trading at 125.5 cents. Currently, Mont Belvieu is at 129 cents. WTI crude was priced at $95.40 per barrel in 2014; currently it is at $92.66 per barrel. In 2014, propane inventory was at 42.433 million barrels. Currently, total U.S. propane inventory is at 49.752 million barrels and has experienced three above-average draws in a row.
By the start of 2015, propane was pricing about 75 cents per gallon lower, crude was valued at $43 per barrel less and propane inventories were improved by 30 million barrels. Anyone looking at the similarities between 2014 and today would certainly be reasonable in asking if the year-over-year changes from 2014 and 2015 might be repeated this year. Unfortunately, for propane buyers, the odds are strongly against a repeat. This is where context is so important.
The place we must focus is on crude oil.
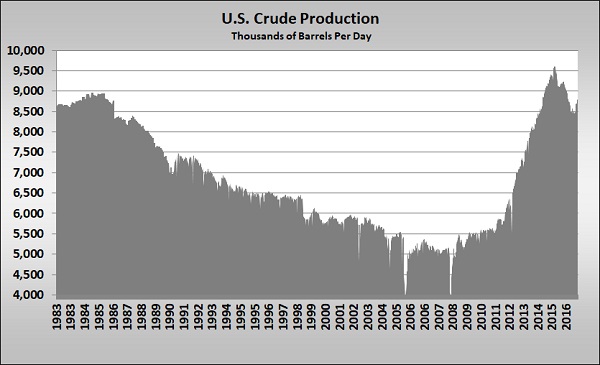
Chart 1: Cost Management Solutions
Chart 1 shows U.S. crude production in 1983 through 2016. For nearly three decades, U.S. crude production had been falling. The result was significantly higher crude prices. Eventually, the high price justified the high cost of recovering crude from shale formations. The U.S. had plentiful reserves in shale formations, but up until around 2007 it had not been economically viable to recover those reserves.
The period after 2007 saw such a dramatic change in U.S. crude and natural gas production that it has been referred to as the shale revolution. At the start of 2007, U.S. crude production was at about 5.4 million barrels per day (bpd). By the start of 2014, production had climbed to 8.1 million bpd. During this period of U.S. production gains, OPEC had been decreasing its production to keep crude prices from collapsing. By 2014, it had seen enough.
Frustrating to OPEC was that its production cost was a fraction of producing from shale formations. Crude needed to be about $70 per barrel to break even on production from shale formations, while OPEC could break even below $10 per barrel. By cutting its own production, OPEC was keeping crude prices elevated enough to keep shale production viable. OPEC concluded it could drive the U.S. companies producing in shale formations out of business by not limiting its production. It implemented a new strategy focused on gaining crude market share at all costs, concluding it would drive the pesky U.S. shale producers out of business. OPEC and other large conventional producers not only stopped cutting back on production to make room for U.S. production; they began to maximize their own output. It seemed like a logical plan, but it failed in spectacular fashion.
As the OPEC plan began, innovations in shale production and economies of scale had driven the cost of producing crude from shale formations to between $40 and $50 per barrel. Remarkably, U.S. producers continued to drill at an unprecedented pace even as OPEC increased its production. At the beginning of 2014, there were 1,378 rigs actively drilling for crude in the U.S. and by October, with the OPEC strategy well underway, there were 1,609 rigs active. U.S. production had risen another 806,000 bpd to 9 million bpd.
At this point, U.S. drilling would begin to slow markedly. The OPEC plan was actually working. But the U.S. had such a huge backlog of wells drilled but not completed, its production continued to increase for a while longer. The result: The world was awash in crude oil, resulting in the collapse of crude prices. The problem for OPEC and other producer nations was that they were too dependent on revenues from crude, and the low crude price was hurting them even more than U.S. producers. By the start of 2016, WTI crude was priced at $36.76 per barrel. Producer nations were forced to abandon their market share strategy.
At the same time, all of the new oil and gas production was causing propane supplies to surge. The nation was not equipped to handle the new production, which eventually drove propane prices down into the 20-cent-per-gallon area. It took some time to build the infrastructure to handle the new propane production, but it is now in place.
This scenario will not repeat in 2022. What OPEC could not accomplish in destroying the U.S. energy industry back then was almost accomplished when crude prices totally collapsed during the pandemic. U.S. producers were already stretched thin financially by what OPEC had done between 2014 and 2016. When the pandemic hit, many were unable to survive, and those who remained had no choice but to become more fiscally responsible. No longer was increasing production the singular focus. Cost reductions, less capital spending, better returns to stockholders and paying down debt became the focus. To this point, that remains the business plan of U.S. producers.
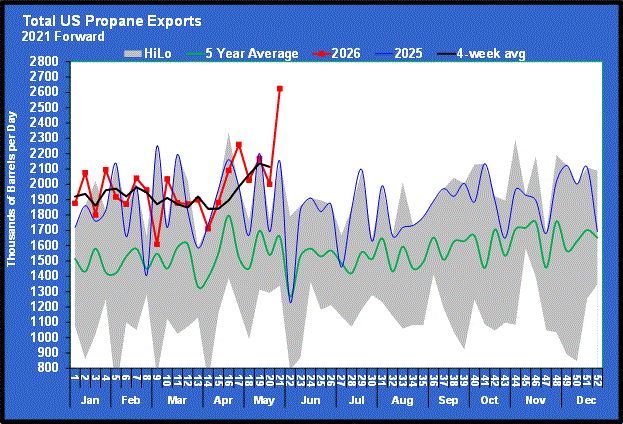
In 2022, U.S. crude prices are expected to reach nearly $100 per barrel by the end of the year. They are already well on their way. There are fears of a shortage for crude, not a surplus as in 2015. At the same time, the U.S. propane export market has fully matured, helping to balance domestic supply and demand, undergirding propane prices. Slower growth in U.S. oil and gas production will mean slower growth in U.S. propane supplies. Meanwhile, global demand for propane is growing primarily from new PDH plants that turn propane into propylene.
As Table 1 shows, propane’s price has averaged 83.94 cents to start the winter since 2013. We don’t think conditions are conducive to prices reaching that level this year. That is why we have been trying to set the expectation that layering in price protection for next winter will likely need to start happening well above that mark this year. At this point, we would consider any price below a dollar a gift. We will hope buying conditions improve, but be careful not to set your price expectations too low or you could be going into next winter with no price protection at all. Unless crude pricing and propane fundamentals change dramatically over the next six to eight months, that will not likely be the desired position.
Call Cost Management Solutions today for more information about how client services can enhance your business at 888-441-3338 or drop us an email at info@propanecost.com.
You May Also Like
-
The US, Iran and propane: A retrospective
Jun 22, 2026 -
Iran peace deal’s impact on propane markets
Jun 15, 2026 -
How the US-Iran war draws on propane inventory
Jun 8, 2026

Subscribe to LP Gas
If you enjoyed this article, subscribe to LP Gas to receive more articles just like it.