Dealing with propane demand volatility
Trader’s Corner, a weekly partnership with Cost Management Solutions, analyzes propane supply and pricing trends. This week, Mark Rachal, director of research and publications, examines the volatility in U.S. propane demand.
Catch up on last week’s Trader’s Corner here: Contangoed vs. backwardated crude price curves and propane prices
Chart 1 shows U.S. domestic propane demand.
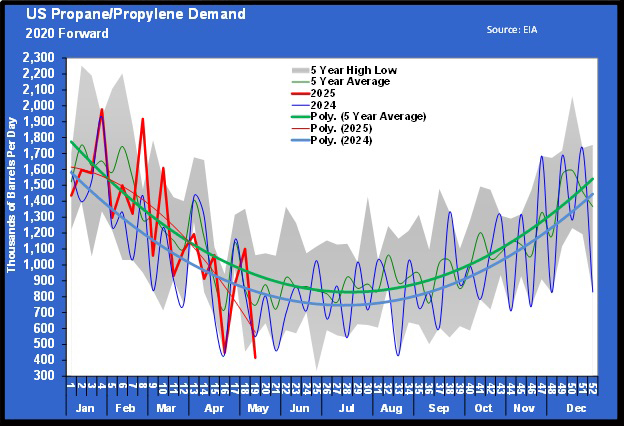
Note the red line and how volatile demand is from week to week. It is so volatile it is hard to see what is happening with demand, so we usually show a trendline in bold red and minimize the weekly changes, so it is easier to see how demand is compared to the five-year average and last year. But in this case, we want you to be able to see the volatility, so we have minimized the trend line and maximized the weekly change line.
As we will show, the weekly volatility for propane exports is similar. Just last week, the U.S. Energy Information Administration (EIA) reported a 685,000-barrel drop in U.S. domestic propane demand from 1.101 million barrels to 416,000 barrels. Do we think domestic demand really swung that dramatically in one week? No.
As we have written, the U.S. demand number is a calculated number. The EIA collects data on inventories, production, imports and exports, and then calculates how much U.S. domestic demand must have been to balance the numbers. We believe the timing of the reporting on export cargoes causes this weekly volatility. For example, last week, the EIA said that U.S. propane exports increased 533,000 barrels per day (bpd). While exports probably did increase, it may not have been by that much if a cargo or two for one week showed up in another week’s numbers.
For the most part, demand is demand, and whether that demand was domestic or export is less important for inventories and pricing. A look at total demand is probably the most useful, and if you look at it over a few weeks rather than week to week, some of the volatility is removed as well. Chart 2 does just that. It is combined domestic and export demand and uses a four-week average.

Total demand continues to run higher than last year, but at least it is trending toward last year. Domestic demand was stronger this year. Heating degree-days since July 1, 2024, are 5 percent higher than the previous year, and most of the increase can be attributed to the January storm. The chart clearly shows the impact of this year’s winter storm in January and February. Inventories have not recovered from that surge in domestic demand.
Part of the reason that replenishing inventories is taking longer is increased export demand. There may have been some unusual activity there as well because of the tariff situation. We believe exports may have been heavier in April due to countries trying to get ahead of tariffs. Things slowed down in early May, and propane prices dropped. Then, last week, China dropped its tariff on U.S. propane from 125 percent to 10 percent. There was an immediate uptick in propane prices following that announcement.
Furthermore, Energy Transfer has completed an expansion of its export terminal, which means export capacity is up. So, what we want to do next is see if that is causing an increase in exports, which would limit inventory builds, even if domestic demand is now running normally.
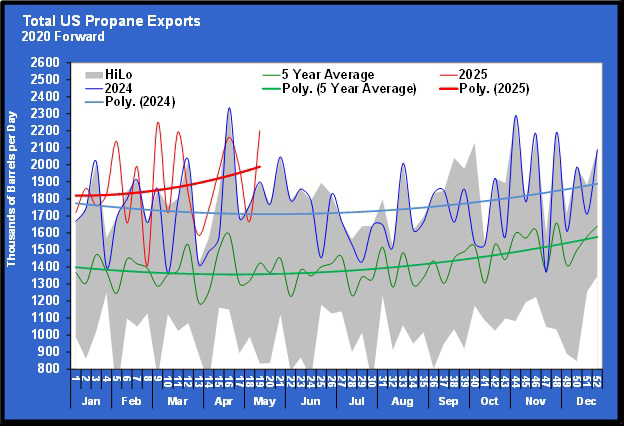
Again, we see the weekly volatility in exports, just like it was there for domestic demand. Those two are yin and yang. If exports jump sharply during the week, domestic demand usually falls correspondingly. As we said, this is because U.S. domestic demand is calculated so that if exports jump, domestic demand is calculated lower and vice versa.
Next, we note that exports are indeed up over last year. In 2024, U.S. exports averaged 1.757 million bpd, right at the 1.8 million barrels widely accepted as U.S. propane export capacity.
During the first 19 weeks of 2024, exports averaged 1.743 million bpd. During the first 19 weeks of this year, exports have averaged 1.876 million barrels. Given the increase over such a long period, it would suggest that the expansion at Energy Transfer is already having an impact. Even if you have the capacity, the world must want the propane. At this point in the year, the world has imported an additional 134,000 bpd of U.S. propane over what it did during the same period last year. So, not only does it appear that new export capacity is available, but it is also being used.
To offset the uptick in domestic demand during the first quarter and export demand for the year, U.S. propane production must rise. Otherwise, inventories will decline, and prices will rise.
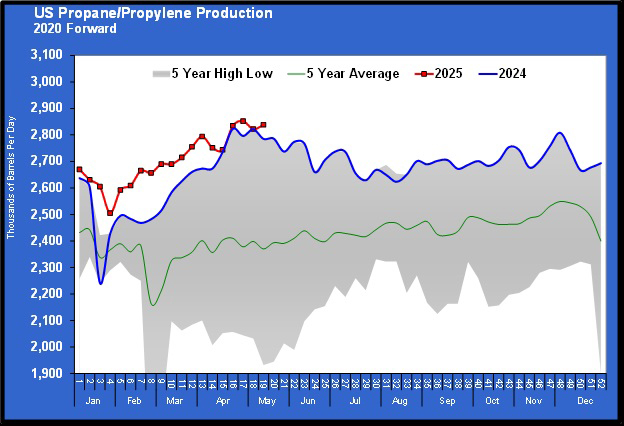
U.S. propane production has been higher than last year and is near the record high set a couple of weeks ago. Unfortunately, production is only 100,000 bpd higher than during the first 19 weeks of last year. That is 34,000 bpd less than the increase in exports. Propane imports are up nearly 20,000 bpd this year, but that still means exports alone are running 14,000 bpd more than the supply has increased so far this year. And at this point in the year, domestic demand has averaged 91,000 bpd higher than last year.
Again, the domestic demand increase is largely due to the winter storm, and the impact was mostly felt in the first quarter. The year-over-year increase in domestic demand is likely to average itself down in the coming weeks. But to this point, demand has outpaced supply, making the replenishing of inventories slow, which is supporting propane prices.
Propane buyers must hope that propane production remains steadier than it did last year through the summer. We simply can’t afford for production to drop off from this point as it did last year. We were encouraged to see the uptick in production last week, but there is a problem. Crude prices are low and have a good chance of remaining low and possibly going even lower. If crude production declines as a result, it will almost certainly decrease propane production, since much of our propane supply is associated with production from crude wells.
It is a hard thing for any of us to pull for, but from a selfish propane buyer perspective, it would be better if WTI crude’s price moved back toward $70 per barrel. But OPEC+ is increasing production, and the United States may make a deal with Iran that will allow more of its crude to go to market. Plus, there is an outside possibility that the Russia/Ukraine war will end, which could put more Russian crude into the market.
At this point, it is hard not to conclude that overall propane prices are going to be higher than last year. We are not predicting that, but we will let the data speak for itself. Propane buyers got a surprising price pullback in early April, and many jumped on the opportunity. There is the possibility that events will play out to create a similar opportunity in the coming weeks leading up to next winter. If it does, propane buyers need to be aware that the fundamentals are pointing to a higher pricing environment and respond accordingly.
All charts courtesy of Cost Management Solutions
To subscribe to LP Gas’ weekly Trader’s Corner e-newsletter, click here.
You May Also Like
-

2026 LP Gas Rising Leader: Gabe Jones
Feb 27, 2026 -

Faces & Places: February 2026
Feb 24, 2026


Subscribe to LP Gas
If you enjoyed this article, subscribe to LP Gas to receive more articles just like it.