Gallon sales rise in latest report from PERC
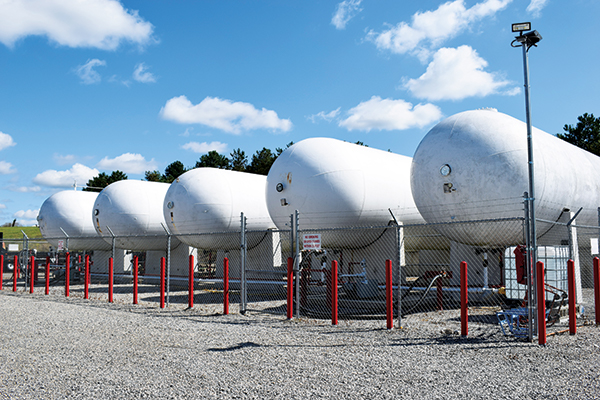
Michigan passed California to become the top-ranked state by total sales in 2018, after being ranked second in 2017. Photo by LP Gas Staff
Michigan has surpassed California as the No. 1 purchaser of propane, according to the recently released Annual Retail Propane Sales Report, an account of the nation’s gallons-sold details available from the Propane Education & Research Council (PERC).
Co-author Michael Sloan of the ICF consultancy – commissioned by PERC to prepare the study using data compiled from the latest reporting year (2018) – says “the survey is much, much better than it has been in the past.”
Joined by ICF’s Eric Kuhle, Sloan and PERC collaborated on preparing a series of methodology enhancements to net a better industry response rate of 78 percent, compared to last year’s participation tally of 75 percent.
“Allowing this report to be available to the industry is a key factor” for assisting marketers in formulating their business plans, says Grace Willis, PERC’s director of strategic operations.
“We want to see where the growth opportunities are in the various states. All states are not created equal” regarding propane load levels and usage applications. “Marketers are specializing a bit more than they used to,” she adds, with an increasing pace of mergers and acquisitions being tracked as well.
The gallon-sales data is also used by the state associations in their communications to put into perspective the size of the propane market within their states, Willis notes. By law, PERC must return to the states 20 percent of the assessment it collects, with the money being allocated in proportion to each state’s propane sales.
Overall gallon sales
Per figures from 2018, as compiled in December’s 2019 report, retail U.S. odorized propane sales totaled 9.3 billion gallons, a 13.6 percent year-on-year increase from the 8.2 billion gallons sold in 2017. Compared to the past 10 years, total sales are 9.56 percent above the 10-year average of 8.6 billion gallons.
On average during 2018, the United States had warmer-than-normal weather conditions throughout the year, while significant portions of the West experienced record droughts. Two major hurricanes made landfall in the Carolinas and Florida Panhandle. However, winter conditions during calendar year 2018 were 11.6 percent colder than 2017, which supported a sharp year-on-year increase in winter heating load across most of the United States.
Midwest
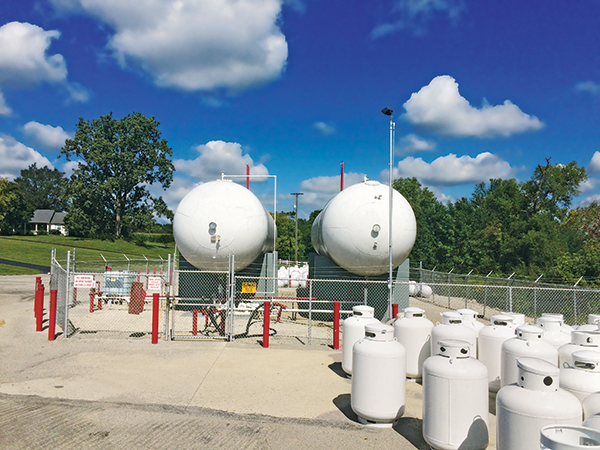
Sales to the domestic retail propane market have increased modestly during the past 10 years. Photo by LP Gas Staff
The Midwest accounted for 38.5 percent of total U.S. propane sales, a small relative increase from the 37.6 percent share in 2017. In 2018, the region was 15 percent colder compared to 2017 and roughly 5 percent colder than the 20-year average from 1999 to 2018.
Residential sales increased from 59 percent of total sales in 2017 to 63 percent of the region’s propane sales, or 2.271 billion gallons.
Year-on-year increases in sales are driven by colder-than-normal winter weather, given the high space-heating loads and the relatively unchanged number of residential households using propane over the past five years. Agriculture sales totaled 548 million gallons, representing 18 percent of total regional sales.
South
The South accounted for 26.9 percent of total U.S. propane sales. Following one of the warmest winters in 2017, the large year-on-year increase in propane demand was supported by colder-than-normal weather and increased demand from the agriculture sector.
Texas was 46 percent colder in 2018 than 2017, with heating degree-days rising from 1,346 to 1,961, while other states in the South were between 13 percent and 34 percent colder than 2017.
Residential sales totaled 46 percent of total sales, increasing from 959 million gallons in 2017 to 1.155 billion gallons in 2018. Propane continued to lose market share to electricity for household space heating, although there has been a slowdown in the reduction of households that use propane for space heating. In 2018, the South region averaged 256 gallons sold per residential account, a 24 percent increase from 2017’s average of 207 gallons.
West
The West accounted for 16.8 percent of total U.S. propane sales. Following a warmer-than-normal winter in 2017, winter temperatures in the Rockies and Southwest regions were 9 percent colder in 2018. The region averaged 432 gallons sold per residential account, an 8 percent increase from 2017’s average of 401 gallons.
Residential sales were 47 percent of total sales, increasing from 699 million gallons in 2017 to 736 million gallons in 2018. Agriculture, commercial and industrial sales increased year on year, increasing 12 percent to 648 million gallons, while internal combustion sales declined to 87 million gallons.
Northeast
The Northeast accounted for 17.8 percent of total U.S. propane sales and experienced a 13.9 percent increase to more than 1.656 billion gallons in 2018. In 2018, the region was 2 percent colder than the 20-year average, supporting increased sales per account and total heating demand. The Northeast region continued to experience a net increase in propane-heated households, having risen 26 percent from 2012 to 2018, including a 2.7 percent increase in 2018.
Residential sales account for 62 percent of total sales in the Northeast, with commercial volumes accounting for an additional 27 percent. This region has the highest share of residential and commercial sales, accounting for 89 percent of regional sales in 2018, or 1.470 billion gallons. In 2018, average residential sales per account increased by 18 percent from 2017 to average 397 gallons per account.
Top five states
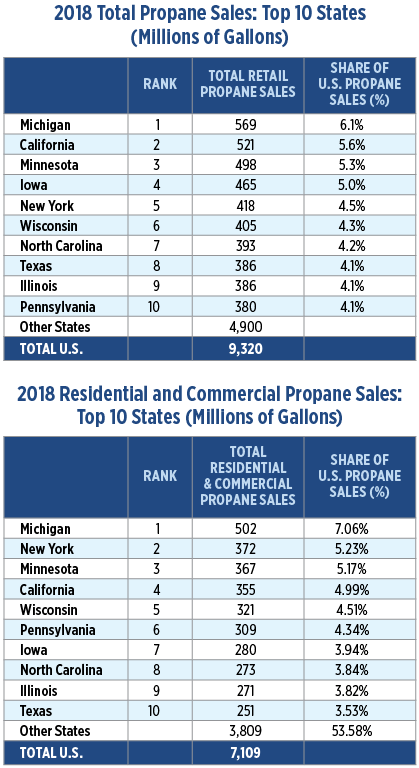 In 2018, the top 10 states by total retail sales accounted for 47.4 percent of total U.S. propane sales, while the remaining 40 other states and the District of Columbia delivered 52.6 percent.
Michigan passed California to become the top-ranked state by total sales in 2018, after being ranked second in 2017. Michigan was also the top-ranked state in residential sales, totaling 453 million gallons for 2018.
“While much of that is driven by weather demand,” says Willis, “it is nonetheless notable.”
California was the second-ranked state by total sales in 2018, and was the top-ranked state for the commercial market with 136 million gallons, the cylinder markets with 45 million gallons and the internal combustion sector with 46 million gallons.
Minnesota remained the third-ranked state by total propane sales in 2018, and was ranked second in the residential and agriculture sectors, which totaled 299 million and 111 million gallons, respectively.
Iowa moved from the fifth- to the fourth-ranked state by total sales in 2018, increasing to 465 million gallons. The state remained at the top for agriculture sales and was ranked fifth in the residential sector.
New York was the fifth-ranked state by total gallon sales in 2018 and was ranked third in the residential sector and fourth in the commercial sector, which totaled 283 million and 89 million gallons, respectively.
Selected sectors
In 2018, there were nearly 12 million total residential accounts across the United States, a slight decline from 2017 levels. These residential accounts include 5.7 million households across the country that use propane for primary space heating. There are roughly 2.2 million retail propane accounts in the other market segments.
The residential sector accounted for 55.6 percent of total sales, or 5.184 billion gallons. The sector averaged sales of 436 gallons per account.
The commercial sector accounted for 20.6 percent of total sales, or 1.924 billion gallons. The sector averaged sales of 1,765 gallons per account.
The agriculture sector accounted for 10.4 percent of total sales, or 966 million gallons. The sector averaged sales of 1,914 gallons per account.
The industrial (non-forklift) sector accounted for 4.4 percent of total sales, or 412 million gallons. The sector averaged sales of 2,230 gallons per account.
The cylinder markets sector accounted for 3.8 percent of total sales, or 354 million gallons. The sector averaged sales of 1,305 gallons per account.
The internal combustion sector accounted for 5.1 percent of total sales, or 479 million gallons. The sector averaged sales of 3,349 gallons per account.
Sales to the domestic retail propane market have increased modestly over the past 10 years, fluctuating with changes in weather, relative fuel pricing and general economic conditions, the report points out.

In 2018, residential propane sales per household increased by 17 percent to average 896 gallons. Photo: Bill Oxford/iStock / Getty Images Plus/Getty Images
From 2008 to 2018, American odorized propane volumes averaged 8.6 billion gallons per year. The report observes that while odorization volume assessments do not directly indicate sales, they do represent a reliable estimate that can be used as a proxy for annual retail propane sales volumes, which totaled 9.45 billion gallons in 2018.
From 2008 to 2018, residential propane sales declined from 5.4 billion gallons in 2008 to 5.2 billion gallons in 2018. This decline was the result of both a decline in total households using propane for residential space heating as well as continued improvements in energy efficiency.
In 2018, residential propane sales per household increased by 17 percent to average 896 gallons. This reverses several years of lower-than-average residential sales due to warmer-than-normal weather. The increase of propane sales in 2018 is partly due to 2018 being a colder year than the 10-year average. The longer-term decline in propane sales is consistent with improved energy efficiency, offset somewhat by higher penetration of propane water heating and other appliances such as cooking and clothes drying.
From 2008 to 2018, U.S. propane production has experienced an unprecedented increase, rising from 15.8 billion gallons in 2008 to over 30 billion gallons in 2018 (including minor volumes of propylene). This increase was almost entirely due to growth in natural gas and liquids production, with propane production from gas processing plants increasing by 13.3 percent from 2017 to 2018 to total 21.4 billion gallons in 2018, more than double the 2018 retail propane sales.
The propane industry has undergone a dramatic transformation from a primarily domestically focused market to one focused more on growing exports. U.S. propane/propylene exports increased from 0.8 billion gallons in 2008 to 14.5 billion gallons in 2018. Exports now represent more than 50 percent of U.S. production and are significantly larger than odorized propane sales.
You May Also Like
-

LPG Spotlight: Newport Propane
Jul 8, 2026


Subscribe to LP Gas
If you enjoyed this article, subscribe to LP Gas to receive more articles just like it.


Love the data.
In depth and informative.