Making sense of propane inventory swings
The Energy Information Administration’s (EIA) Weekly Petroleum Status Report tracks the rise and fall of U.S. propane inventory. Propane retailers probably watch inventory levels closer than any other data point in determining their supply management strategies.
It would probably be safe to say that inventory level sets the tone for propane supply management in our industry. However, the other data points are just as important to monitor in order to provide clarity on inventory changes.

The table above is part of a much larger summary of EIA’s data that we send to clients and subscribers about 30 minutes after EIA releases its data. It provides the data points that are part of the inventory picture.
For the week ending Nov. 20, EIA reported that U.S. inventory had increased 1.736 million barrels, and for the week ending Nov. 27, it decreased 2.1 million barrels. That means inventory went from building 248,000 barrels per day (bpd) one week to declining 300,000 bpd the next week, a swing of 548,000 bpd.
Let’s look at the inputs for each week and see how they changed to result in such a dramatic change in U.S. propane inventory.
First, U.S. imports dropped from 158,000 bpd to 86,000 bpd, a decline of 72,000 bpd. Imports can swing widely from week to week. To see that kind of decline is not a surprise.
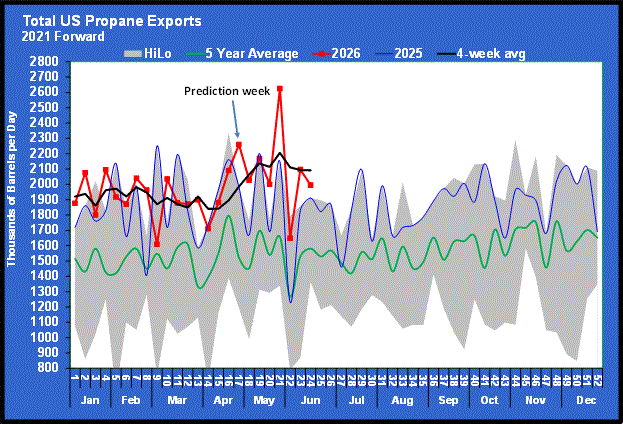
Exports stayed flat at 729,000 bpd. Each week, EIA estimates propane exports, but unfortunately, official data lags by about two months. The last official data was for September. During that month, 22.171 million barrels of propane were exported – a rate of 739,033 bpd. Sometimes the weekly estimates for a period and the official exports can show a fairly wide disparity.
The next data point is simply the difference between imports and exports. Imports add to domestic supplies, while exports subtract from domestic supplies. For the week ending Nov. 27, net import/export activity resulted in 643,000 bpd less domestic supply. That was 72,000 bpd less domestic supply than the previous week.
EIA obtains reports from natural gas processing plants and refiners to help it calculate the domestic production of propane. Those reports showed domestic production decreased by 27,000 bpd on a week-to-week basis to 1.641 million bpd.
Combining the net import/exports with domestic production yields how much supply was available for domestic consumption. Doing so shows there was 99,000 bpd less propane available for domestic consumption last week. Less total available supply for domestic consumption lends itself to the big swing in inventory. However, it is still far from accounting for the 548,000 bpd week-to-week change.
This brings us to the key data point for this week: domestic demand. What’s interesting here is that demand is an implied number. In other words, there are no reports coming into EIA concerning demand. Propane retailers are not submitting reports each week telling EIA how much propane they delivered. Instead, EIA takes input on the supply side and reports on inventory and implies demand to make the numbers balance.
If data input from any of the other sources is off, then demand could be skewed. Last week, EIA reported that domestic propane demand increased by 449,000 bpd. That was a 52.9 percent increase from 849,000 bpd to 1.298 million bpd.
There had to be a major change in the weather pattern to cause demand to change so dramatically. For the period that corresponds with this EIA report, the National Oceanic and Atmospheric Administration reported 140 heating degree days compared to 102 the previous week. The 140 heating degree days for that week was seven below normal. The temperature data explains why heating demand was up for that week. But was it enough to account for a 52.9 percent increase in demand? Heating degree days increased 37 percent week-to-week, so probably not.
To account for the rest of the increase, there could have been an increase in the petrochemical use of propane, which is part of domestic demand. There also could have been more exports than EIA estimated. The reason we mention those two possibilities is that the bulk of the inventory draw came on the Gulf Coast, with a drop of 1.6 million barrels. Petrochemical use and exports are key drivers of Gulf Coast inventory changes.
What we must realize is that the sharp jump in domestic demand only got it up to normal. It was the very weak demand over the last few weeks that was the anomaly. We know that crop drying was a non-event and winter temperatures have been mild so far, so the weak demand reported by EIA was “explainable.” There is also the possibility that some data input was off for a few weeks and there was some “catching up” this week.
The key point is that we must remember that some of the data that results in the numbers being reported is estimated and other parts are implied. And there could be errors due to the amount of data collection necessary to generate EIA reports. It is best not to overreact to one week’s report. Obviously, with time, the data becomes more accurate. It might be best to consider the trend over a few weeks when making supply decisions rather than reacting to just one week’s data.
Cost Management Solutions LLC (CMS) is a firm dedicated to the analysis of the energy markets for the propane marketplace. Since we are not a supplier of propane, you can be assured our focus is to provide an unbiased analysis.
For more Cost Management Solutions analysis of the energy market that helps propane retailers manage their supply sources and make informed purchasing decisions, visit www.lpgasmagazine.com/propane-price-insider/archives/.
You May Also Like
-
Crude still not out of the woods
Jun 29, 2026 -

Aaron Huizenga on the leadership power of curiosity
Jun 27, 2026 -
The US, Iran and propane: A retrospective
Jun 22, 2026 -
Iran peace deal’s impact on propane markets
Jun 15, 2026
About the Author: Allison Kral
Allison Kral was a senior digital media manager at LP Gas magazine.
Subscribe to LP Gas
If you enjoyed this article, subscribe to LP Gas to receive more articles just like it.