Making sense of volatile crude inventories
Trader’s Corner, a weekly partnership with Cost Management Solutions, analyzes propane supply and pricing trends. This week, Mark Rachal, director of research and publications, parses through the first quarter of U.S. crude inventories data.
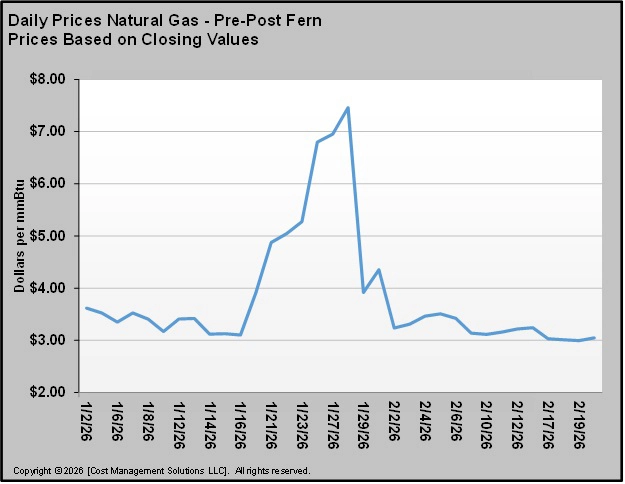
Catch up on last week’s Trader’s Corner here: Impacts of Winter Storm Fern on propane market fading
It has been an odd first quarter of the year when it comes to U.S. crude inventories.
Normally, crude inventories are built in the first quarter. It is a time when refineries will take units down for maintenance, thereby decreasing their throughput or demand for crude. Refineries are making repairs and preparations during this time to maximize gasoline output during the summer driving season. The driving season is between Memorial Day and Labor Day.
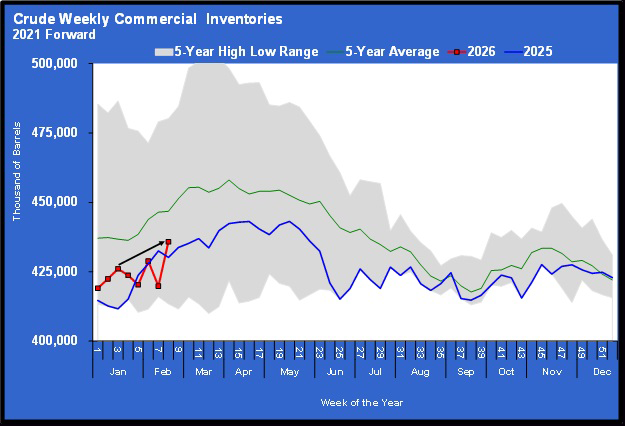
Note in chart 1 the unusual draws on inventories that you did not see last year and that are not reflected in the 5-year average. The draws on inventories certainly got our attention, given how unusual they were. They were also supporting higher crude prices.
For the week ending Feb. 20, the Energy Information Administration (EIA) reported that U.S. crude inventories gained a colossal 16 million barrels, raising them to 435.804 million barrels. We have put a line from where inventories made their unusual departure from building to where they are after that huge build. It is worth noting that had the typical trendline for inventories been followed, they would likely be very close to the level reported last week.
When inventories first started dropping, we simply assumed it was due to the impact of Winter Storm Fern disrupting crude production. Refineries running at normal rates while crude production was disrupted would have required calls on inventories to meet the needed demand.
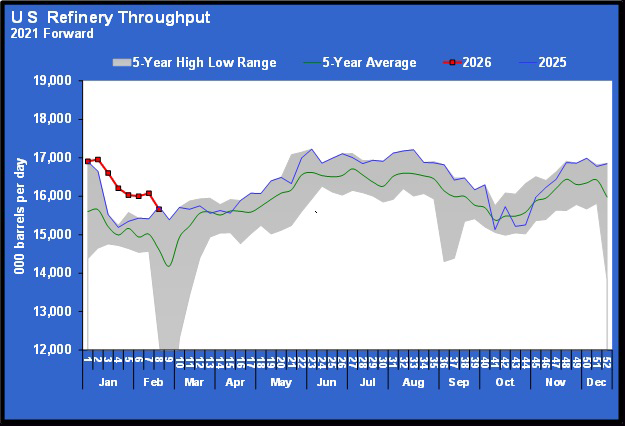
Note that until last week, refineries were processing at a higher-than-normal rate. That would certainly impact crude inventories. Then, last week, the throughput rate suddenly tumbled, which coincided with the massive jump in crude inventories.
When we see unusual movements in data, especially across several data points, it raises the question of whether the data is correctly being reported to the EIA. We may never know the answer to that question, but the possibility certainly exists. However, in this case, there may be enough underlying evidence to say the numbers make sense.
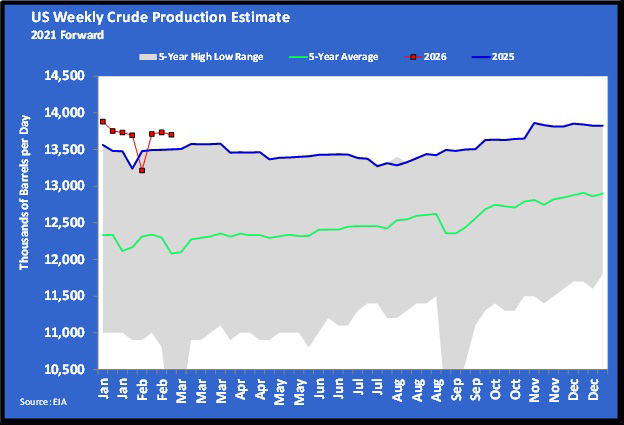
U.S. crude production did dip during the storm.
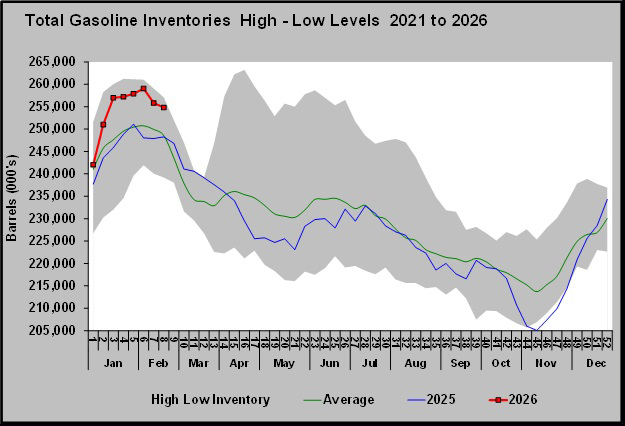
U.S. gasoline inventories had much higher-than-normal builds in the first two months of this year.
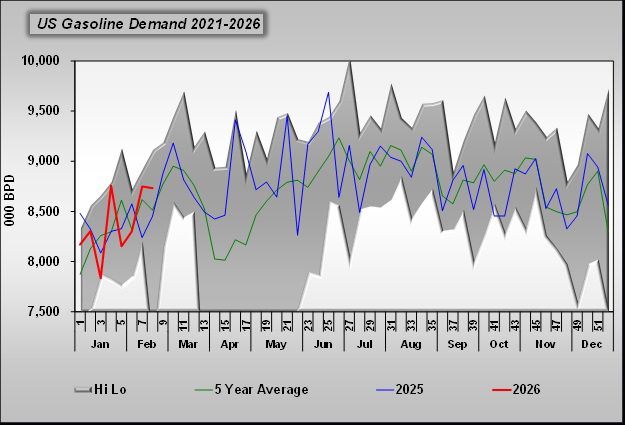
Gasoline demand was also good. Demand has been 26,000 barrels per day (bpd) higher than last year and 93,000 bpd higher than 2024 through the first eight weeks of the year.
The numbers suggest inventories could have declined in the weeks leading up to this massive build, even though such a decline is highly unusual. Still, the 16-million-barrel increase in and of itself is hard to explain, especially if the data in the preceding weeks was accurate.
So many things impact the price of propane. Propane’s own fundamentals, such as inventories and production; unpredictable weather; crude’s price, which of course is impacted by its fundamentals; geopolitics, as we have seen recently; government policies; and economics. It’s complicated enough as it is for the buyer of propane or any other commodity, without unusual or hard-to-explain movements in the data being reported.
When the data is unusual, it creates uncertainty in the market, and if apparent adjustments are made, it can cause prices to move in expected ways. This movement could put a propane buyer on the wrong side of a supply position.
Propane buyers are often looking far out into the future to establish the price of a portion of their supply. But situations such as this unusual activity in crude suggest that locking down the price on a higher percentage of supply near the time of delivery may be warranted.
For example, let’s say a retailer is going into the upcoming month with the price locked in on 30 percent of their supply. That price may have been locked in many months earlier, when the market gave the retailer a good opportunity. Thirty percent of supply with a known cost may be enough when taking long-term positions.
But as we near the delivery time, if market conditions provide a reasonable price to add additional price protection for the next 30 to 60 days, it might be a good idea to do so. That takes the unknown out of a higher percentage of supply. As we have seen, hard-to-foresee or hard-to-time events like wars, and yes, even unusual data reporting, can quickly change the pricing environment.
Buyers can take unusual events that can push prices sharply higher in the short-term largely off the table by taking additional short-duration positions to augment the longer-term positions they have established.
Charts courtesy of Cost Management Solutions.
To subscribe to LP Gas’ weekly Trader’s Corner e-newsletter, click here.
You May Also Like
-

Aaron Huizenga on the importance of listening
Feb 19, 2026 -
Steady propane prices for 2025-26 winter
Feb 17, 2026


Subscribe to LP Gas
If you enjoyed this article, subscribe to LP Gas to receive more articles just like it.