March 2020 Market Watch: Propane sales by division, district
Each month, ICF provides LP Gas with updates on the U.S. propane market, as well as the latest trends. The data for March 2020 focuses on retail propane sales by census division and PADD district.
Stock information for Ferrellgas and Suburban Propane is also provided.
PROPANE MARKET METRICS
| SHARE OF 2018 TOTAL RETAIL PROPANE SALES BY CENSUS DIVISION | ||||
|---|---|---|---|---|
| East North Central | 20% | |||
| East South Central | 5% | |||
| Middle Atlantic | 10% | |||
| Mountain | 8% | |||
| New England | 8% | |||
| Pacific | 9% | |||
| South Atlantic | 15% | |||
| West North Central | 18% | |||
| West South Central | 7% | |||
| SHARE OF 2018 TOTAL RETAIL PROPANE SALES BY PADD DISTRICT | ||||
|---|---|---|---|---|
| PADD I | 33% | |||
| PADD II | 42% | |||
| PADD III | 9% | |||
| PADD IV | 5% | |||
| PADD V | 11% | |||
Source: ICF/PERC Annual Propane Sales Report
STOCK WATCH
| Company | 12-month chart (as of February ’20) | Price (2/28/20) | Current Yield | 52-Week Low | 52-Week High | YTD Price Performance |
|---|---|---|---|---|---|---|
| Ferrellgas – FGP | $0.30 | 0.0% | 0.20 | 1.87 | (11.0%) | |
| Suburban Propane – SPH | 19.57 | 12.3% | 18.50 | 24.89 | (10.4%) |
Source: Company data, FactSet and Wells Fargo Securities LLC.
Note: Ferrellgas delisted from the New York Stock Exchange in January and now trades on the OTC Markets.
*Featured image: MicroStockHub/iStock / Getty Images Plus/Getty Images
You May Also Like
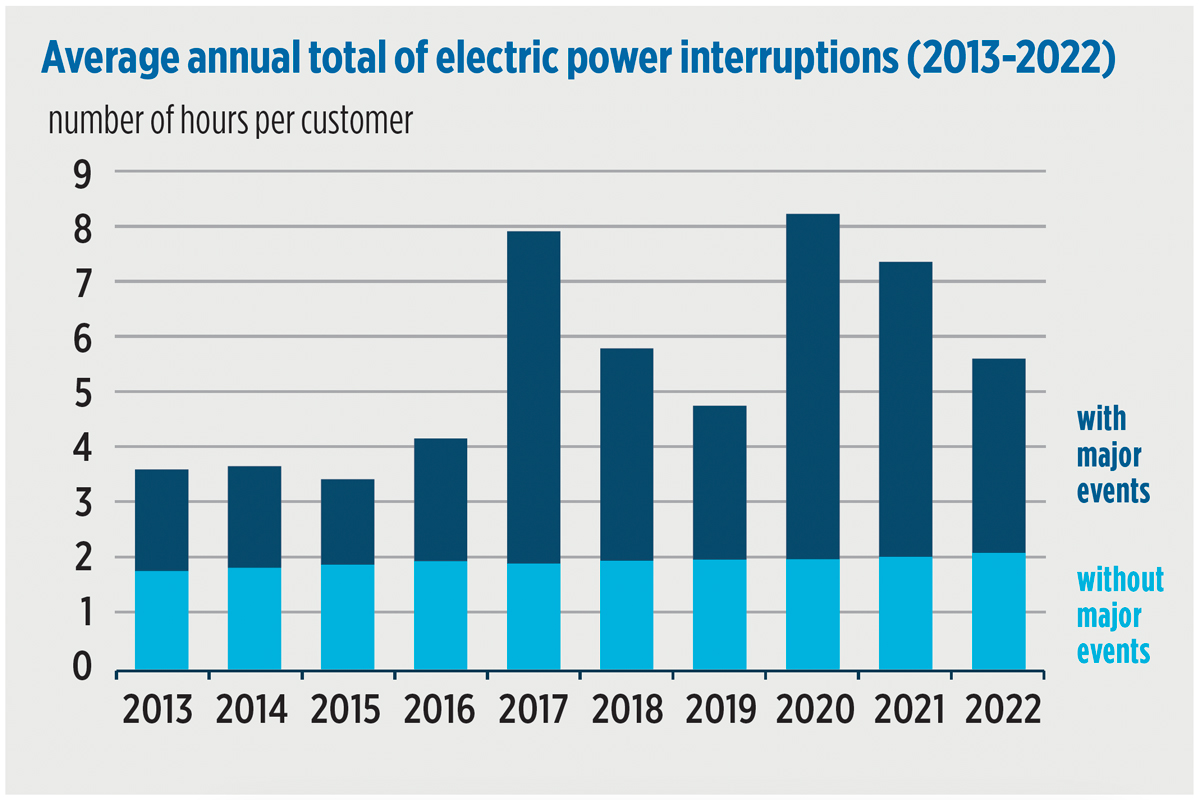
Tracking electric power interruptions
Mar 18, 2024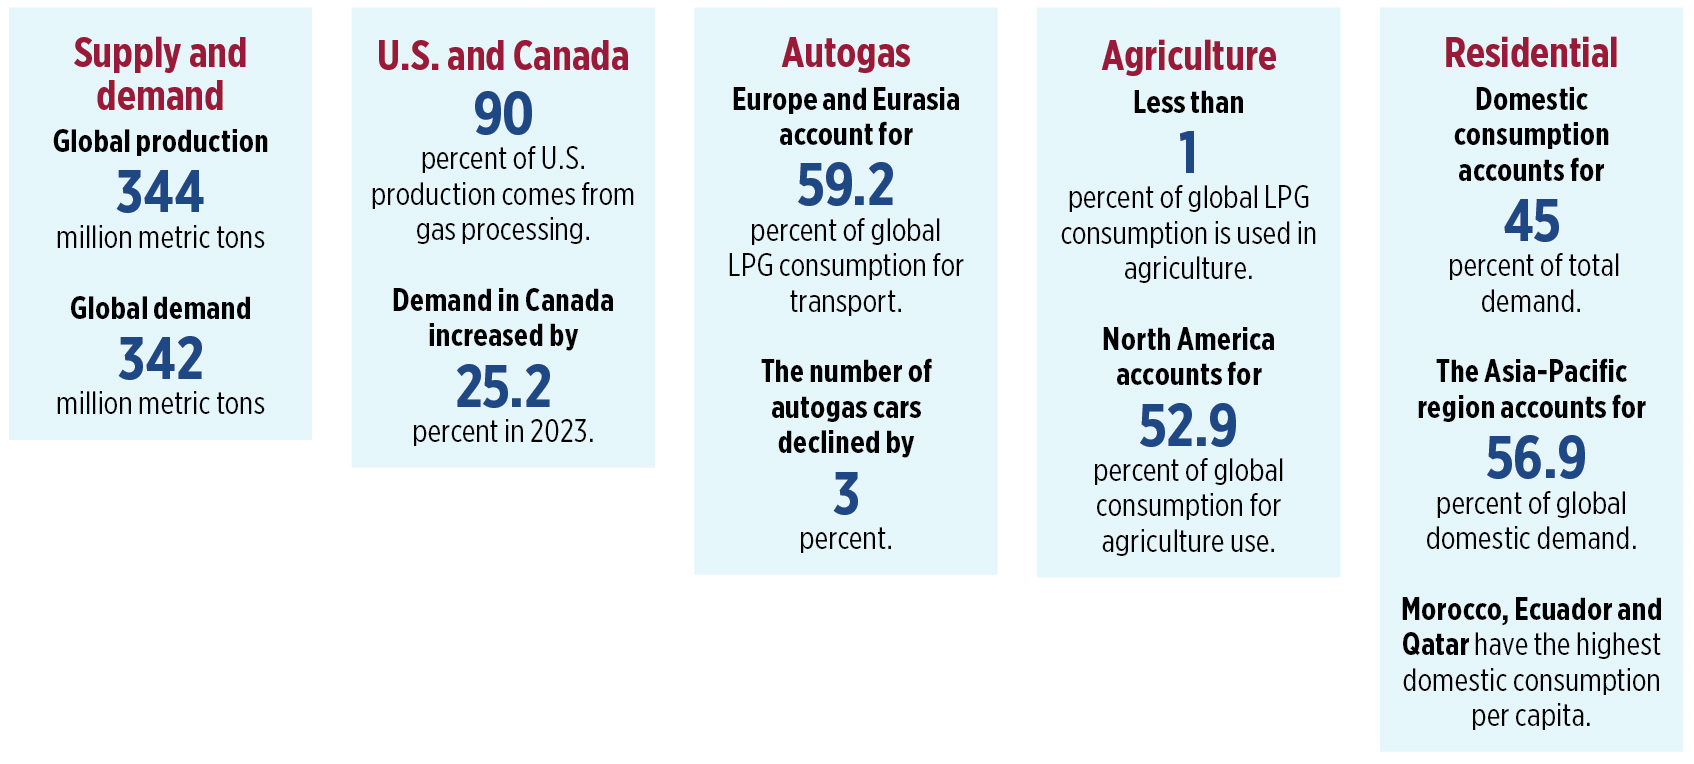
The global LPG industry in 2023
Jan 8, 2024

Subscribe to LP Gas
If you enjoyed this article, subscribe to LP Gas to receive more articles just like it.