Propane demand ahead of the winter heating season
Trader’s Corner, a weekly partnership with Cost Management Solutions, analyzes propane supply and pricing trends. This week, Mark Rachal, director of research and publications, compares current propane demand to past averages.
Catch up on last week’s Trader’s Corner here: Where propane inventories stand as winter nears
In last week’s Trader’s Corner, we looked at propane inventories in detail. We looked at overall inventories, ready-for-sale inventories and regional inventories. Overall, inventories are in good shape to begin winter.
We looked at inventory positions because we are nearing the time when we will shift from inventory accumulation to inventory withdrawals. Chart 1 shows monthly U.S. propane supplied, which equates to total U.S. propane demand.
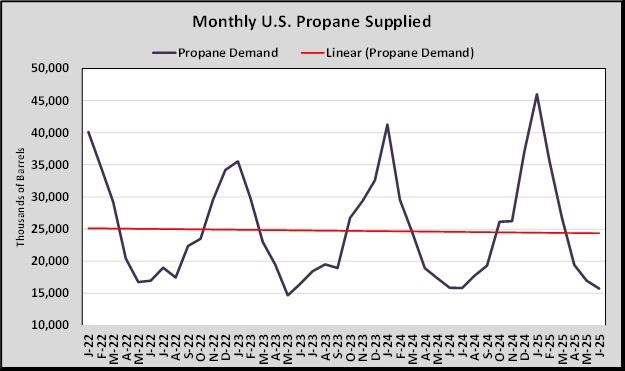
By looking at demand by the month, it is easier to see the seasonality. On average, U.S. propane demand runs about 25 million barrels a month. Unfortunately, the trend is slightly downward. It is possible that tariffs implemented by the Trump administration, if they are allowed to stand, will increase propane demand by petrochemical companies that turn the propane into products.
Tariffs may help retail demand over time if it leads to more U.S. manufacturing and a stronger U.S. economy. But that may be slower to develop than what happens on the petrochemical side. Gains in demand from either area aren’t a given, but we feel that a stronger U.S. manufacturing base as well as economic expansion might reverse the long, slow decline of U.S. propane demand.
As one would expect, demand falls below the average during the summer months, allowing inventories to build. But we have just entered the time of year when demand is increasing again, and it will eventually exceed production, and imports and calls on inventories will have to be made. As we pointed out last week, the drawdown in inventory can begin anywhere between the first of September to the end of November.
The highest demand month is January. Since 2022, demand in January has ranged from about 35 million to 46 million barrels. Obviously, January is the month when the propane supply chain will be put to its biggest test and therefore is the month that obtaining supply will be the most challenging. Overall, the supply will be there, given the level of inventory, but getting it where it needs to be is always a challenge. Inevitably, some areas struggle to meet local demand.
In case you are wondering, since the Energy Information Administration started providing this data in January 2010, the highest monthly demand reported was 45.994 million barrels and the lowest was 13.098 million barrels.
While U.S. demand has struggled to grow, there has been no such struggle in export demand or propane production. Both have been growing rapidly.
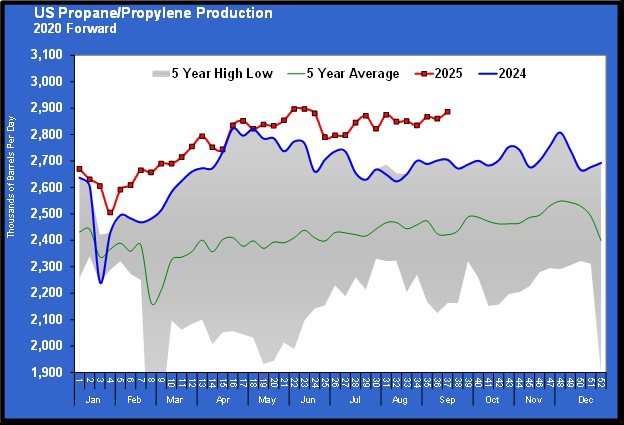
U.S. propane production is running near record highs. The highest daily production on record was 2.897 million barrels per day (bpd) in June of this year. Production last week was 2.886 million bpd. At that level of production, it only takes about nine days each month to meet average U.S. demand. After that, propane is being exported or stored. U.S. monthly production of propane is more than double even the highest domestic demand month of January. Plus, we have averaged about 111,000 bpd of propane imports adding to supply. There is no shortage of propane in the United States.
With domestic demand stagnant at best and production growing, U.S. propane exports have to take the excess.
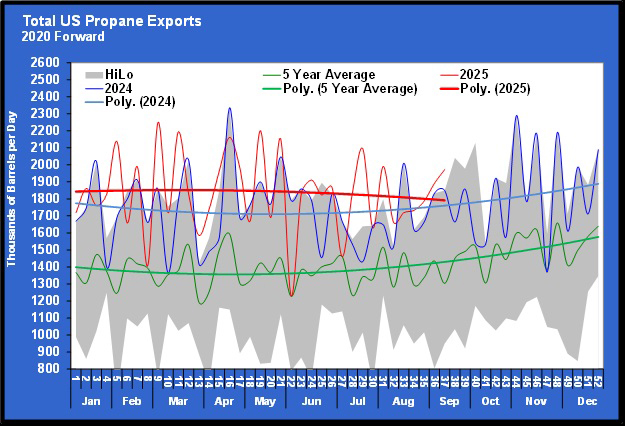
In Chart 3, propane exports vary widely each week, so we add trend lines to the chart to make it easier to decipher the overall change. Note the green line is the five-year average. Then note how much higher last year’s (blue line) exports were than that average. That provides some scale as to how rapidly exports have been rising.
Between 2023 and 2024, exports increased 113,000 bpd. So far this year, exports are up 105,000 bpd more than this point in 2024. In 2024, U.S. domestic propane demand averaged 959,000 bpd. From 2016 through 2024, export demand increased by 1.044 million bpd. That means that just the growth in exports over the last eight years has more than matched annual domestic demand. So far this year, exports have averaged 1.836 million bpd compared to domestic demand at 998,000 bpd.
Even with exports so robust, propane inventories have been building. Before last winter, propane inventories reached a record 103.135 million barrels. During the week ending Sept. 12, 2025, they reached 98.931 million barrels. They reached the record high during the second week of October 2024. With four more weeks left this year until the second week of October, inventories must build an average of 1.051 million barrels per week to match the record. Or they must build for longer than they did last year. Matching the record will be a tough order to fill, but at the same time, it is not one that needs to be filled for there to be adequate inventories available for this winter.
Charts courtesy of Cost Management Solutions
To subscribe to LP Gas’ weekly Trader’s Corner e-newsletter, click here.
You May Also Like
-

LP Gas Hall of Fame profile: Denis Gagne
Mar 27, 2026 -

LP Gas Hall of Fame profile: Bob Barry
Mar 25, 2026 -
Overseas markets lift US propane prices
Mar 23, 2026 -

LP Gas Hall of Fame profile: Joe Armentano
Mar 23, 2026

Subscribe to LP Gas
If you enjoyed this article, subscribe to LP Gas to receive more articles just like it.