Propane inventories helped, not fixed
Trader’s Corner, a weekly partnership with Cost Management Solutions, analyzes propane supply and pricing trends. This week, Mark Rachal, director of research and publications, reports on the state of U.S. propane inventories.
Catch up on last week’s Trader’s Corner here: New propane export capacity coming online amid tariff policy swings
The propane inventory data released by the Energy Information Administration (EIA) on June 5 that represented the state of inventories for the week ending May 30 was a bit surprising. The EIA reported that U.S. propane inventories increased by 6.844 million barrels, with the majority coming in much-needed ready-for-sale (RFS) inventories. RFS inventories were 5.619 million barrels of the total increase, meaning that the inventory upstream of the fractionators increased by 1.225 million barrels.

The big build lifted total propane inventories to 1.14 percent above the five-year average inventory level for this time of year. Inventories were 6.887 million barrels (10 percent) below last year.
Keep in mind that last year, inventories reached a record high of 103.135 million barrels before the start of winter. With the way inventories were pulled down this past winter, it is going to be hard to get back to such a record before the start of winter. It will depend on the weather as to how inventories will look at the end of the next heating season.
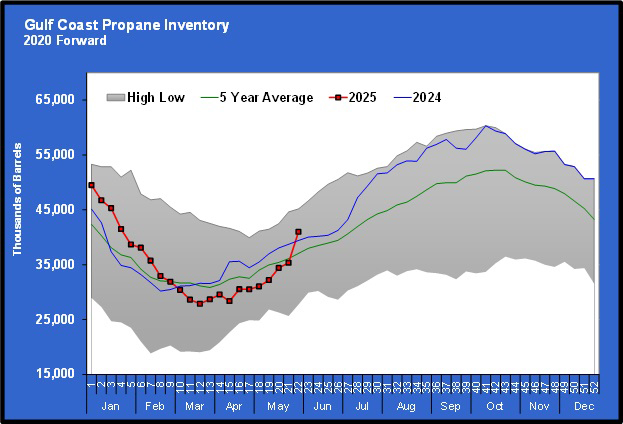
While pushing above the five-year average helped alleviate some concerns about inventories, it didn’t relieve all of them. Most of the inventory build occurred in Gulf Coast inventories, which are now above last year and the five-year average.
On the other hand, Midwest inventories are still lacking.
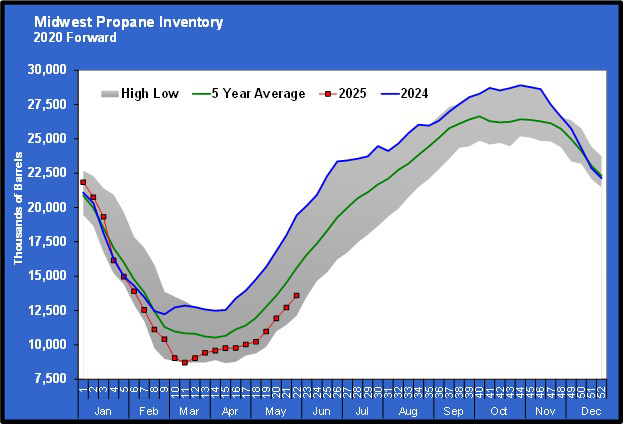
Midwest inventories are at 5.848 million barrels (30.1 percent) below last year at this time and 11.28 percent below the five-year average. East Coast inventories are also low at 1.54 million barrels below this time last year.
There are even concerns on the Gulf Coast.
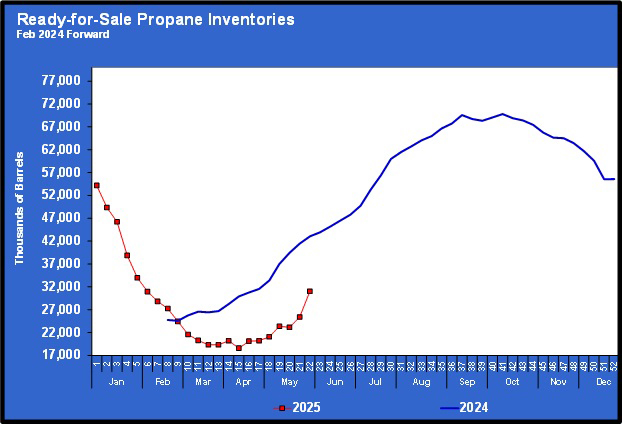
RFS inventories are 12.012 million barrels (27.9 percent) below last year. Keep in mind that we only started getting this data point in February 2023, so it is hard to know if last year’s levels were on the high side, but we suspect they were, given that overall inventories were high. Still, traders will respond to what they know, and they know that RFS inventories are well below last year’s levels.
Furthermore, we think that traders are going to be a bit skeptical about last week’s build holding up. There were some odd numbers in last week’s EIA data that allowed the huge build to occur. Namely, propane exports dropped 918,000 barrels per day. That is the equivalent of about two large propane carriers each day. That is a massive falloff.
We can’t say that such a falloff didn’t occur, but we would not be surprised by a big jump in propane exports with the next EIA report and a resulting light inventory build.
Propane prices dropped when the EIA reported the inventory build on June 4, but outpaced crude higher on June 5 and are up sharply again as we write this article on the morning of June 6. That tells us that traders are unsure whether the inventory situation has improved as much as this latest data would suggest.
With the big build for the week ending May 30, if inventory gains can remain at least average going forward, it may keep pressure off propane prices. However, we can’t count on that possibility until we see if the build holds up against the test of time. Inventories look far better than they did the week that ended May 23, but will they still feel better after a couple more EIA reports? Trading in the last couple of days would suggest the majority of traders have their doubts, given the uptick in prices.
Charts courtesy of Cost Management Solutions
To subscribe to LP Gas’ weekly Trader’s Corner e-newsletter, click here.
You May Also Like
-

LP Gas Hall of Fame profile: Brian Sheehan
Mar 30, 2026 -

LP Gas Hall of Fame profile: Denis Gagne
Mar 27, 2026


Subscribe to LP Gas
If you enjoyed this article, subscribe to LP Gas to receive more articles just like it.