Propane inventory draw not concerning
Trader’s Corner, a weekly partnership with Cost Management Solutions, analyzes propane supply and pricing trends. This week, Mark Rachal, director of research and publications, examines the most recent Energy Information Administration status report.
Catch up on last week’s Trader’s Corner here: Following up on refinery utilization
Wednesday, Oct. 8, was a bit of a strange day for propane. On that day, the Energy Information Administration (EIA) released its Weekly Petroleum Status Report, providing its latest data on the U.S. energy industry. The data it released was collected on Oct. 3.
The morning the data came out, propane prices were sharply lower ahead of the EIA report. Far more often than not, over the years, we have seen prices ahead of the EIA data accurately reflect what the data reveals. For example, prices being lower ahead of the report would generally be followed by EIA data showing a build in propane inventory.
We have never been quite sure how pricing activity before the report so accurately reflects the data. Perhaps traders are just that good at predicting inventory changes. Perhaps information is getting out before the official report comes out. Either way, we are always surprised when the market activity before the EIA report doesn’t reflect the data from the report.
In the case of Oct. 8, there was a large inventory draw. We would have expected prices to be higher leading up to this draw, yet they were falling. What is more, when the data was released, prices didn’t recover and, in some cases, weakened even more. When things transpire that aren’t “normal,” our curiosity is always piqued.
First, let’s look at what happened with inventories.
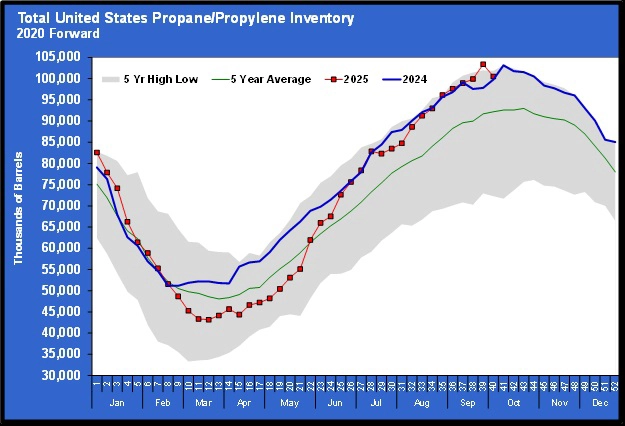
Total U.S. propane inventories declined 2.875 million barrels. That should have been bullish for prices. It was not reflective of the bearish pricing activity in the market at the time. But the draw followed an exceptionally large inventory build of 3.458 million barrels the previous week. That high build put inventories at a new all-time high. Perhaps the build was the true anomaly, and the draw was simply a correction of the previous week’s data.
When we see builds and draws that are out of the normal range, we try to focus more on the trend or the average changes. If we average the large draw and the large build, it would have resulted in a 292,000-barrel-per-week build in inventory over the past two weeks, which would be nearer normal for this time of year.
That record inventory position will always be on the books, but we are not so sure it was accurate. The underlying data showed big swings that generally indicate something was up. For example, U.S. domestic demand jumped 940,000 barrels per day (bpd) – from 534,000 bpd to 1.474 million bpd week-to-week. That could happen, but the mild weather that has been present suggests that kind of weekly change is unlikely.
So, perhaps the fact that the pricing activity before the EIA report did not reflect the incoming data was simply because traders were expecting the adjustment. But if that were the case, we would have expected propane prices to at least follow crude’s prices. Crude was up that morning, so the drop in propane’s price, even if traders were ignoring the inventory change, was atypical.
We inquired of traders what they might be seeing that could lead to a weakness in propane prices. One suggested that large holders of propane were getting stopped out. What does that mean? Traders, especially those speculating, sometimes set a price at which they will close their positions. When they take a position where they will benefit from higher prices, they will set a price somewhere below what they bought to minimize the loss on the position should prices fall. This price is called a stop. It is often referred to as a sell stop because when the price hits that point, it will trigger a sell of the position. In the case of large traders, this could be programmed into computers that will cause the sale to happen automatically.
This kind of activity would be considered technical in nature. Technical trading involves trading based on price information rather than on a commodity’s or company’s fundamentals. Thus, technically generated trading activity can sometimes cause price movements that are counter to the fundamental data available in the market.
Another trader said the price softness was caused by a drop in demand in Asia. Asia is a key destination for U.S. propane exports, so a drop in demand would certainly cause downward pressure on prices.
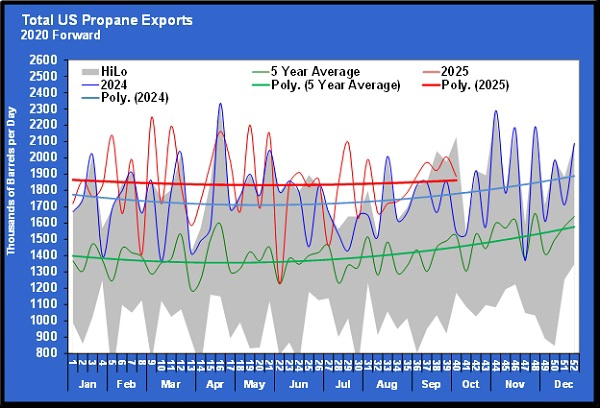
Chart 2 shows propane exports. Exports this year averaged 116,000 bpd higher than last. That is 1.844 million bpd compared to 1.728 million bpd during the same period last year. But if you look closely at the bolder red trendline, you can see it is moving closer to last year’s rate recently. That could be an indication that export demand is weakening.
However, we may not know for a few weeks if the trader was correct. Buying for export can occur well ahead of when the exports take place. In other words, if weaker demand is occurring in Asia, it would impact pricing well before the lower demand is reflected in the fundamental data.
If this trader is right, given the mild temperatures in the United States, we would expect more builds in propane inventory to be highly likely. We are not in the least worried about this past week’s inventory draw, and at this point, propane pricing has reflected that sentiment in the broader market. We would not be surprised if a new inventory high is achieved before sustained drawdowns in inventories begin. But even if this draw was the beginning of sustained drawdowns, supply is in great shape.
The best news is that propane futures prices are down due to this weakness, which is beneficial for those looking for price protection this winter and the next two winters.
Charts courtesy of Cost Management Solutions
To subscribe to LP Gas’ weekly Trader’s Corner e-newsletter, click here.
You May Also Like
-
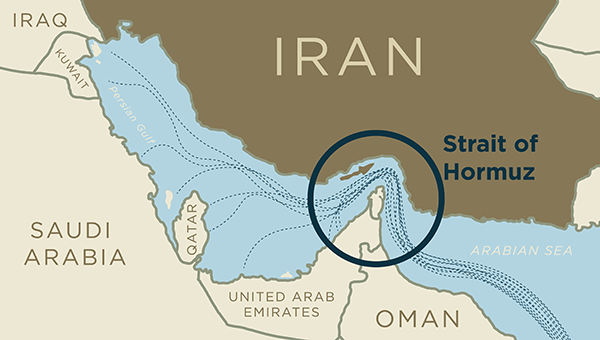
Impacts of US-Iran conflict on propane market
Mar 9, 2026 -

2026 LP Gas Rising Leader: Brookes Townsend
Mar 9, 2026 -

2026 LP Gas Rising Leader: Johnny Thomas
Mar 6, 2026


Subscribe to LP Gas
If you enjoyed this article, subscribe to LP Gas to receive more articles just like it.