Propane inventory getting tighter
Trader’s Corner, a weekly partnership with Cost Management Solutions, analyzes propane supply and pricing trends. This week, Mark Rachal, director of research and publications, examines why propane inventory is getting tighter.
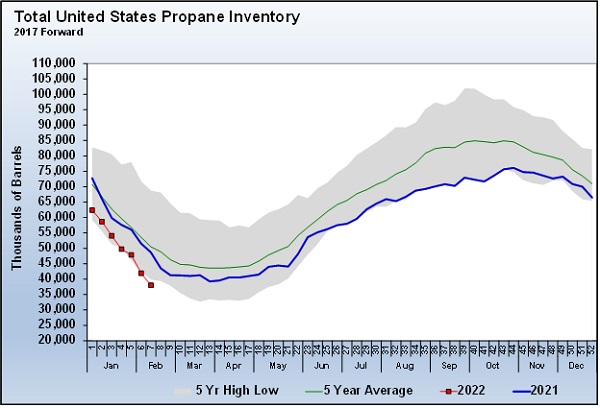
For the week ending Feb. 18, the Energy Information Administration (EIA) reported a 3.901-million-barrel draw on U.S. propane inventory.
Of course, it is not unusual to have inventory fall this time of year. A survey of industry analysts prior to the report showed an average expectation for a 3.6-million-barrel draw on inventory. Over the last five years, week seven of the year had averaged a 3.103-million-barrel draw.
The draw dropped U.S. propane inventory to 38.002 million barrels. That was a five-year low for week seven of the year.
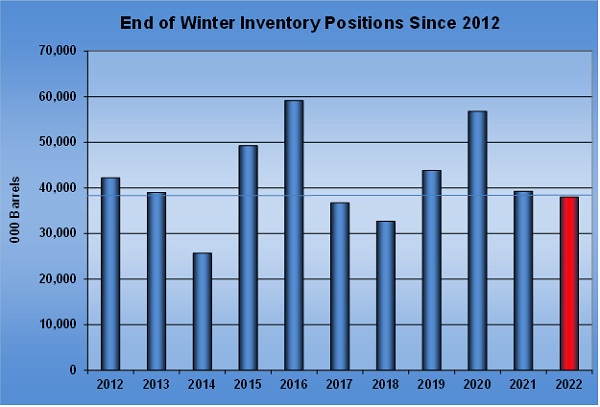
Chart 2 shows where inventory ended the winter drawdown period since 2012. The current inventory position is now below seven of the previous 10 end-of-winter positions.
The low-inventory position has occurred between the first week of March through the last week of April over this period. If we follow historical patterns, there will be at least three more, and possibly as many as 10 more, EIA inventory reports before the low-inventory position for this year will be posted.
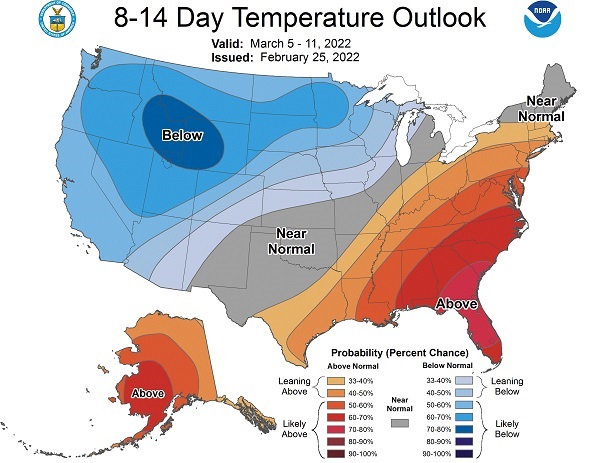
Temperature outlooks that looked supportive to begin the week of Feb. 14 were not looking so by the end of the week.
The map from the National Oceanic and Atmospheric Administration issued on Feb. 25 projects the probability of temperatures being above, below or at normal ranges. This outlook covers the March 5 through March 11 time frame. About a third of the nation, including some high-consuming areas, is expected to be above normal. Still, there is enough of the country that is expected to be normal to below normal to potentially cause inventory draws.
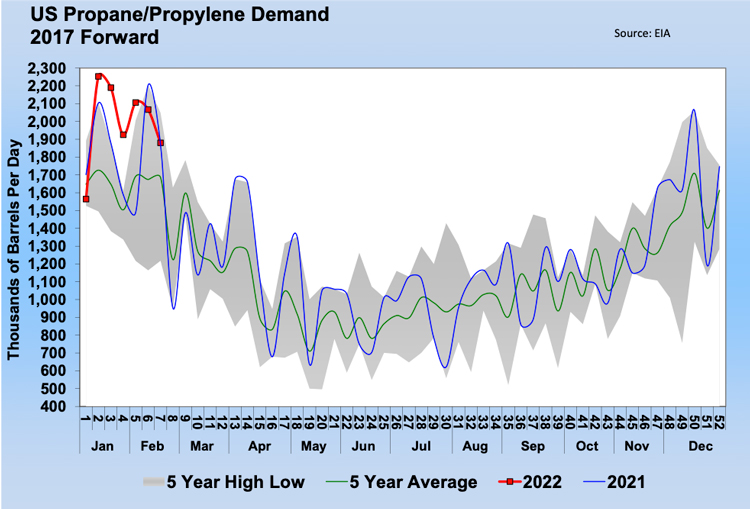
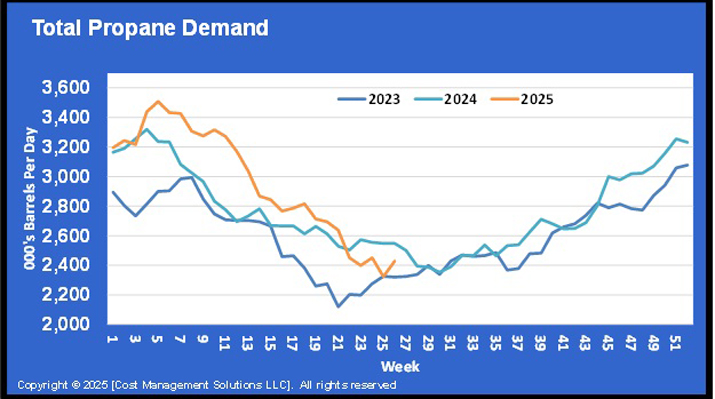
Despite a winter that has been below normal and below last year in terms of heating degree-days, U.S. propane demand had been running higher than last year. This has been a consistent theme since the pandemic began.
In 2021, U.S. propane demand was 86,000 barrels per day (bpd) higher than in 2020. So far this year, demand has averaged 164,000 bpd higher. This increase in domestic demand has been a key reason for the above-average decline in propane inventory in 2022.
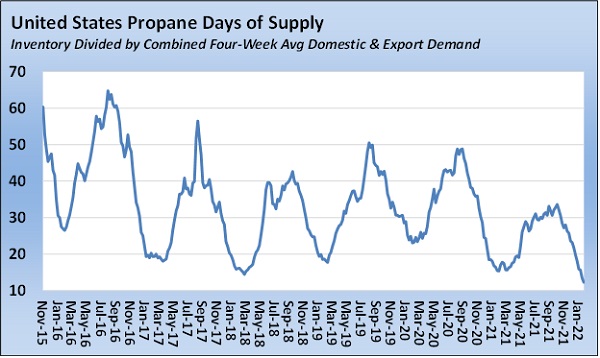
The result is that U.S. propane days of supply is running very low.
Days of supply is calculated by dividing the available inventory by the four-week averages of combined demand domestically and for export. Because of the weekly volatility in demand, a four-week average is used. As of Feb. 18, the days of supply was down to just 12. It’s the lowest since we have been calculating the number.
The bottom line is that regardless of when this year’s inventory drawdown period ends, the industry is going start the buildup to next year’s winter in a hole. No doubt that could keep prices elevated more than most buyers would like as they prepare for next winter. Add to that the geopolitical uncertainty that’s taking place, and it could be a very challenging summer.
Call Cost Management Solutions today for more information about how client services can enhance your business at 888-441-3338 or drop us an email at info@propanecost.com.


