The value of tank monitors exceeds their cost
“If a tree falls in the woods and nobody is around to hear it, does it make a sound?” This philosophical question – a favorite of introductory philosophy courses – deals with whether objects exist if they cannot be perceived.

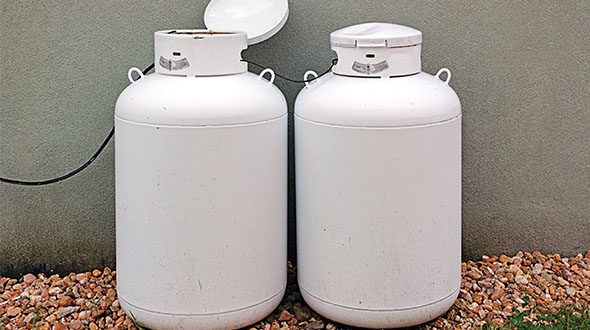
Tank monitors are almost as important as the other appurtenances that you connect to your tank. Photo: Joe_Potato/iStock / Getty Images Plus/Getty Images
The world of propane tanks is far less philosophical. If we’re not around to hear a tank, we’ll find out that it exists if it runs dry. And we’ll find out that the customer exists too, because we’ll hear them screaming for a fill before their pipes freeze. For the uninitiated, that call often comes in the middle of the night.
Regardless of what philosophers might think, monitors fortunately and unequivocally exist. Yet, many retailers seem to ignore their existence. Our philosophy is that they are almost as important as the regulators and other appurtenances that you connect to your tank.
Our philosophy begins with a simple hypothesis:
Value of monitors ≥ cost of monitors
Value of monitors
Our principle value comes from:
- Increased gallons per hour. This is easy if your software has the right tracking and reporting functions. If not, come up with your total gallons delivered (something we all know) divided by the amount of time your drivers spend delivering propane (something you ought to know or be able to estimate). Monitors should increase this because you make fewer stops and deliver more gallons at each stop. Multiply that improvement by your average margin to come up with the value.
- Lower cost per hour. This calculation is easy for the same reason as increased gallons per hour. But if your software does not do it, add these up: fully-loaded driver cost per hour multiplied by hours spent delivering propane; plus bobtail fuel cost; plus bobtail repair and maintenance expense. Some propane marketers also include bobtail depreciation and insurance in this calculation. Economists and cost accountants would never include these items, but go ahead and include them if you want. In our case, we discovered that we spent a lot less time delivering gas, which reduced the hourly cost because it reduced overtime. This was the biggest driver of our reduced cost per hour.
- Improved customer retention. This one requires a leap of faith – or some knowledge of multiple regression for ye of little faith or those with a fear of leaping. The basic idea is that fewer runouts translates into improved customer retention. In our case, we achieved a significant drop in customer attrition. There are many ways to quantify this. Keep reading to find out what we did.
Cost of monitors
Our principal monitor costs are:
- Hardware expense. We do not use this to calculate the cost of operating the monitors because it’s a fixed cost. However, we do use it to calculate the return on capital for our investment in monitors.
- Installation and activation costs. This principally is the labor and transportation costs of activating the monitor at the customer site. This a complicated calculation. We ended up folding installation into an assumed amount of time spent at the customer site, and tried to fold most of the installation into our regularly scheduled deliveries and maintenance.
- Maintenance costs. This includes replacing malfunctioning monitors and battery replacement. We track this cost with specific work orders. Our software tracks the time spent doing this.
- Data transmission. This is the principal variable cost of the monitor used to determine the benefit.
Solution
Once you have all of the information, it’s time to do the math.
There are lots of ways to determine the annual benefit. We did it by taking the difference between:
- The increased margin per hour multiplied by hours spent delivering product; minus
- Annual incremental cost = The sum of the changes in: labor delivery cost; plus fuel delivery cost; plus bobtail maintenance cost
Our benefit was material because we deployed monitors on all company-owned tanks, regardless of delivery method, plus all customer-owned tanks on auto-fill. The biggest benefit came from using the monitor data to reduce will-call runouts by over 40 percent.
If you are a careful reader, this is likely the moment where you think: “What about the upfront cost of the monitors? And whatever happened to customer attrition?”
The short answer is that we used our annual benefit and the upfront cost of the monitor to determine our return on invested capital. For us, that amount was well north of 20 percent.
Finally, we decided not to quantify the impact on customer retention because there’s a lot of noise made by other factors that impact it. Having said that, our year-over-year attrition rate decreased by over 38 percent. Coincidence? If customers are silently happy and stick with you, does your cash register make a sound?
Christopher Caywood is a co-owner of Caywood Propane Gas Inc.


