Understanding a backwardated price curve
Trader’s Corner, a weekly partnership with Cost Management Solutions, analyzes propane supply and pricing trends. This week, Mark Rachal, director of research and publications, explains backwardated pricing environments.
In Trader’s Corner, we just finished a 10-part series on the use of financial swaps to help manage the risk of higher propane supply. Financial swaps can be bought as many as three years out as a matter of routine. Because of this, we recently expanded some of our charts on propane’s cost from one year to three years for the updates and Propane Price Insider report that our daily readers receive.
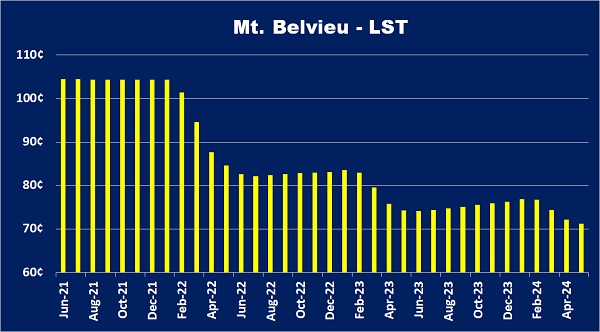
The chart shows how the market had Mont Belvieu propane valued from June 2021 through May 2024 as of June 30.
As you look at the chart, you will note that prices are generally lower the further out in time. This is known as a backwardated price curve. There is a temptation to see that as an indication that prices will be lower in the future. That would be a huge mistake. In absolutely no way is this a prediction of the future price of propane.
The higher price in the front of the curve means that propane supply and demand are tight, and that puts more upward pressure on the spot prices and nearby futures months than it does on propane that will be demanded further out.
An analogy would be if gasoline supplies are tight, and you are on a vacation trip. Nearly out of fuel, you may have to pay a higher price at your current location to get the fuel you need and hope the price down the road is less. If you get to the next station, and gasoline supply is just as tight there, you would probably be willing to pay the same price you paid at the previous station or even more to keep the vacation trip going. Prices won’t go down just because you happen to be farther along your vacation route. They will only go down if there is more gasoline supply than there is demand at some point during the trip.
The charts actually do show the opportunity to buy propane or other commodities for future demand before prices rise. For example, December 2021 propane is valued at 104 cents per gallon, while December 2022 is at 83 cents and December 2023 at 76 cents. Currently, fundamentals suggest the price risk is to the upside, so taking advantage of the lower futures prices may be something to consider.
Of course, there is the risk that fundamentals for propane will become less supportive of prices, and the futures months will not rise. But, if market conditions change, swap buys can be offset by swap sells to shut down the position at the gain or loss they hold at the time.
Using our vacation analogy, you are traveling from east to west, and you note that the majority of the traffic is moving in the same direction you are. Far less traffic is moving west to east. Expecting prices to rise as the hoard of travelers moves west, you decide to call ahead and promise a gasoline station owner that you will stop at his station to buy your fuel if he will agree to sell to you at his current price. Indeed, gasoline prices in the west rise as the hoard of travelers descend upon that region, but you pay a lesser amount per your agreement with the owner you called.
Again, a strongly backwardated propane price curve is an indication of a market that is experiencing a tightness in supply that is making the market pay more for the propane it needs right now. In this environment, as time passes, the price of propane in the future will rise toward the price at the front of the curve. The only thing that can change this is if propane fundamentals change to where there is either more supply or less demand or a combination of both.
In a strongly backwardated pricing environment, you may want to consider using financial swaps to lock the price of supply in future months before prices rise. If propane fundamentals improve, the price curve will begin to flatten out where the current price and the future price have less of a value spread. If this starts occurring, the owner of swaps can consider closing positions by selling swaps for the same months and volumes that they had bought.
If propane fundamentals really improve, the price curve can actually flip and become what is known as contangoed. A contangoed price curve would show propane in the front of the curve valued less than propane further out. Because there is too much supply, the price of propane is driven lower. However, the market naturally assumes the oversupply will correct, so prices further out hold up for longer. If the oversupply does not correct itself, then future prices will tend to gravitate toward the lower values in the front of the price curve as time passes.
Understanding what backwardated and contangoed price curves are indicating about market conditions helps a propane retailer anticipate and take advantage of opportunity on propane they may not demand for two or three years down the road. A retailer would buy swaps for further-out months to take advantage of a backwardated price curve.
Taking these further-out positions is not without risk since market conditions can change over the longer time frame. So, if the retailer is speculating, he must be diligent in looking for signs that market conditions are changing. One indication would be a flattening of the price curve. If conditions begin to change and the retailer assesses that they are going against their position, the retailer may close the position by selling swaps to preserve gains or minimize losses.
Call Cost Management Solutions today for more information about how client services can enhance your business at 888-441-3338 or drop us an email at info@propanecost.com.


