What drives propane inventory levels?
Trader’s Corner, a weekly partnership with Cost Management Solutions, analyzes propane supply and pricing trends. This week, Mark Rachal, director of research and publications, addresses the fundamental drivers of propane inventory levels.
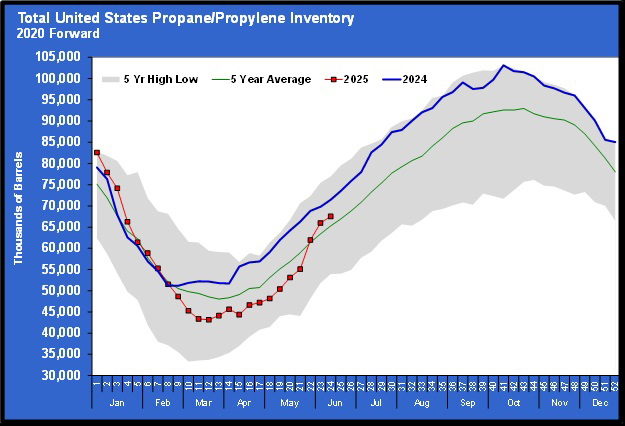
Most of the time, stakeholders in the propane industry focus on propane inventory as the key metric for assessing the health of propane fundamentals. It isn’t a bad place to focus because it is a reflection of all of the different fundamental inputs. But, sometimes looking at the background data can give us a heads-up on potential market direction in a timelier fashion. Right now, U.S. propane inventory is 19.887 million barrels below this time last year. It would probably take a large change in that number to really get someone’s attention and suggest fundamental conditions could be changing.
Watching the trends on the background fundamentals might get us ahead of the curve. That is why in our daily report we focus on different fundamental factors with each day of the week. On Monday, we look at how speculative traders are changing their propane positions. These traders only make money if they choose correctly on market direction, so following their positioning can be a worthwhile guide.
On Tuesday, we focus on natural gas fundamentals since 86 percent of propane supply comes from natural gas processing. On Wednesday, we focus on crude fundamentals because the foundation of propane pricing is set by crude. One only has to look at the changes in propane and crude prices since July 21 to see how closely the two are connected. Since that date, propane’s value has steadily been 64 percent of crude’s value.
On Thursday, our daily report focuses specifically on propane fundamentals. Of course, we start by looking at inventory positions. But we also look at the background data as well. In this Trader’s Corner, we are going to start a two-part series looking at the four fundamental drivers that ultimately determine inventory levels. This week, we will focus on propane demand, specifically domestic and export demand.
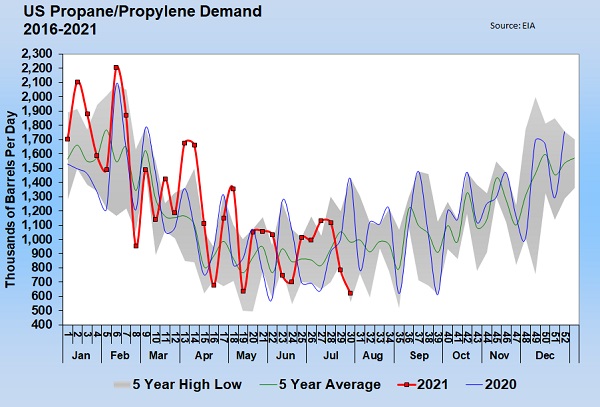
Chart 1 shows U.S. demand for propane. The chart is a little choppy, so looking at the actual numbers can be helpful. Through the first 30 weeks of the year, U.S. domestic demand has averaged 1.251 million barrels per day (bpd). That is up 95,000 bpd from the 1.156-million-barrel average of last year. Of course, the strong second half of last winter got U.S. demand off to a strong start this year. But even since winter, there have been several weeks where new five-year highs are set.
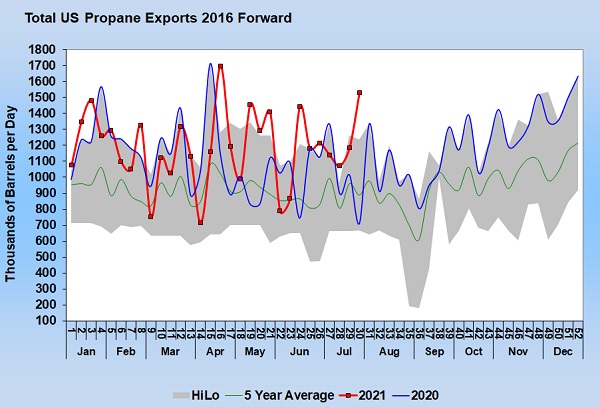
The second area of demand is exports. We all tend to focus on exports because they are now nearly as large as domestic demand. Besides, it’s not surprising that propane buyers get a little more perturbed seeing “our” propane getting shipped away, causing the price of the propane we buy to be higher.
Chart 2 shows that during more than half of the weeks this year, a new five-year high for exports has been hit. You can see pretty quickly that exports generally run higher than the five-year average, and they have posted quite a number of weeks above last year. In fact, so far this year, propane exports have averaged 1.187 million bpd, up 80,000 bpd from the same period last year.
Combined propane demand is up 175,000 bpd this year. In the last couple of years, gains in demand have not been an issue; gains in supply have been more than gains in demand, causing inventories to grow. Obviously, the gains in inventory have been slower this year. Next week, we will look at propane supply to see how it is keeping up with the gains in propane demand.
Call Cost Management Solutions today for more information about how client services can enhance your business at 888-441-3338 or drop us an email at info@propanecost.com.


