Where propane inventories stand as winter nears
Trader’s Corner, a weekly partnership with Cost Management Solutions, analyzes propane supply and pricing trends. This week, Mark Rachal, director of research and publications, examines the current state of propane inventories.
Catch up on last week’s Trader’s Corner here: Getting ahead of rising propane prices
It is the middle of September. Propane inventories have been building since the 13th week of the year, the week ending March 28, and it won’t be long until some of those inventories will be needed to make up the shortfall between demand and production plus imports.
U.S. propane inventories fell to 43.159 million barrels for the week ending March 21 before the inventory build cycle began. Historically, inventories have reached their peak between the first week of September (the 36th week of the year) and the last week of November (the 48th week of the year).
Last week, inventories reached 97.634 million barrels, which may be the zenith for inventories this year. However, there is a good chance more barrels will be added to inventories before this year’s inventory drawdown begins unabated.
Ahead of last winter, propane inventories reached a record high of 103.135 million barrels before being drawn down. This year, inventories are slightly above that record-breaking pace.
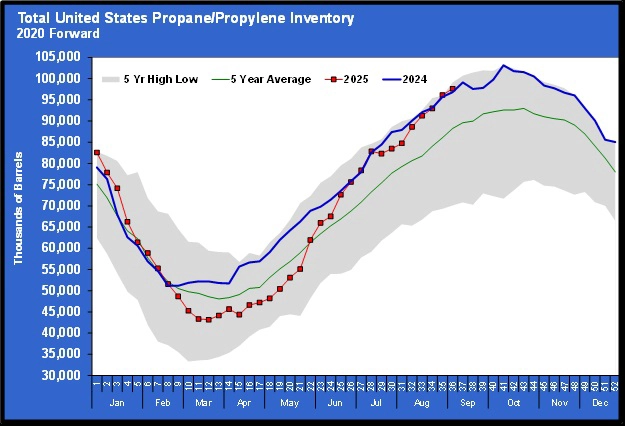
Sometimes inventories can draw down briefly and build again before the continuing inventory drawdown sets in. That was the case last year. Inventories spent most of the first half of the previous winter near record levels. In any case, inventories will have to build another 5.5 million barrels to match last year’s record.
Frankly, coming out of last winter, we had little hope of matching that record again this year, but there is certainly a shot at doing so. Even if that record is not matched, the inventory position will almost certainly be well above the five-year average when the drawdown begins. Inventory is currently 9.377 million barrels above the five-year average. Even if the last inventory build for this year has already occurred, inventories are in good shape to cover whatever comes our way this winter.
Let’s take a quick look at regional inventories.
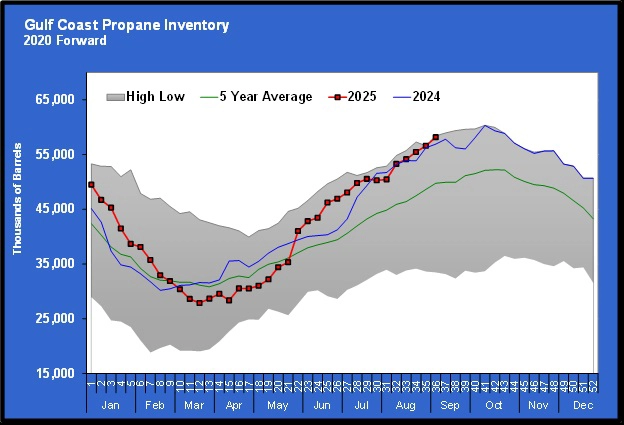
The largest regional inventory position is held on the Gulf Coast, where most of the fractionators and a large concentration of refineries are located. Inventories are right at five-year highs for this time of year. Gulf Coast inventories are at 58.174 million barrels, making up 59.58 percent of the nation’s inventories.
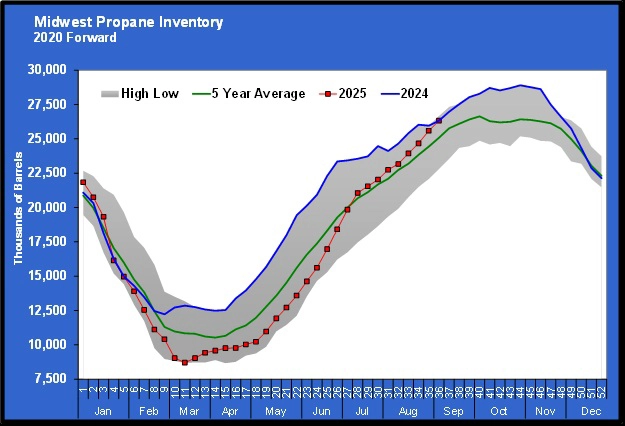
Midwest inventories are at 26.323 million barrels, which may be the biggest surprise of all, given where they were until mid-summer. We didn’t think there was much chance of matching last year, but that is currently the case. The Midwest holds 26.96 percent of the nation’s current inventory position.
East Coast inventories are highly volatile. Currently, they are at 7.908 million barrels.
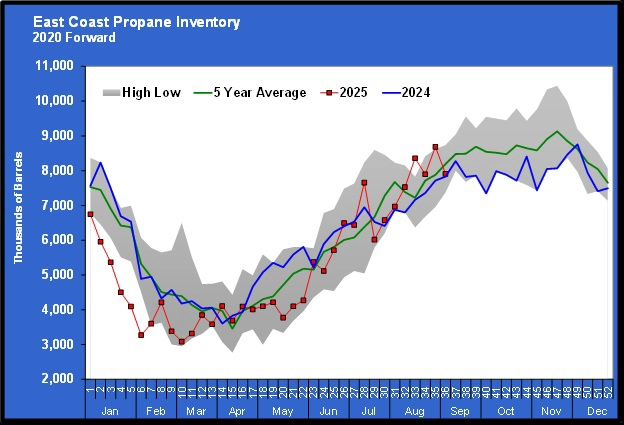
That is near last year’s level. The East Coast holds 8.10 percent of the nation’s total inventory position. Combined, the West Coast and Rocky Mountain regions have 5.228 million barrels of inventory, or 5.35 percent of the nation’s total.
The latest data from Canada had its inventories at 7.894 million barrels at the end of July. That was below the 9.921 million barrels of inventory at that time last year.
Overall, inventories are in a good position. One area of concern is that the amount of inventory that is fractionated and ready for sale is lagging behind last year’s.
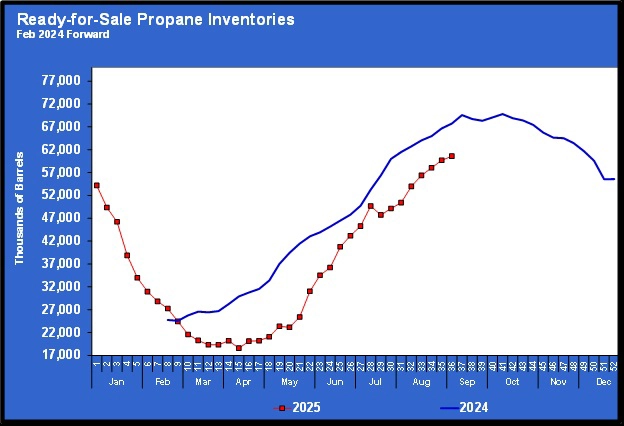
This data was not available until February of last year, so all we know is that the current level is below this time last year. Last year could have been exceptionally high for all we know, but it is still a concern without more information available. Currently, ready-for-sale (RFS) inventory is about 60 percent of total inventory, compared to 70 percent last year. Hopefully, fractionators can convert inventory in Y-grade to RFS at a sufficient rate in the coming months to keep up with winter demand.
Again, overall, we feel good about inventory levels. Of course, these inventories are at the hubs, not necessarily where they are needed. As always, logistical issues will be present, causing shortages at some locations during the winter months. Good inventory positions at the hubs do not mean that retailers shouldn’t keep good inventory on hand throughout the winter period. But hopefully those good inventory positions will keep prices from spiking.
Charts courtesy of Cost Management Solutions
To subscribe to LP Gas’ weekly Trader’s Corner e-newsletter, click here.
You May Also Like
-
Closing of Strait of Hormuz impacts energy exports
Mar 16, 2026 -

An ‘extra special’ NPGA Propane Expo for 2026
Mar 16, 2026 -

2026 LP Gas Rising Leader: Jamison Walker
Mar 13, 2026 -

2026 LP Gas Rising Leader: Josh McKay
Mar 11, 2026

Subscribe to LP Gas
If you enjoyed this article, subscribe to LP Gas to receive more articles just like it.