Contangoed vs. backwardated crude price curves and propane prices
Trader’s Corner, a weekly partnership with Cost Management Solutions, analyzes propane supply and pricing trends. This week, Mark Rachal, director of research and publications, looks at the impact of crude forward price curves on propane prices.
Catch up on last week’s Trader’s Corner here: Fractionation more of a contributor to inventory tightness than originally thought
The price of crude has a tremendous impact on both the current and future price of propane. Propane fundamentals have a lot of impact on propane prices in the spot market and in the nearest futures months. Propane fundamentals impact the propane supply/demand balance. Weather, economic conditions, exports and production levels are examples of fundamentals. Probably the most-watched fundamental is inventory.
The further we move out from the present, the less impact propane fundamentals have on propane’s price and the more traders look at crude’s price as the basis for propane’s price. Propane buyers should understand and monitor crude’s forward price curve to identify where buy opportunities are most likely to present themselves.
In our daily report, we provide crude’s forward price curve for three years out. Crude is traded far beyond three years, but propane is not. The propane futures market is about 36 months. Right now, a buyer of propane can make hedges for the months of May 2025 to April 2028. That is why we limit our crude price curve to three years.
Chart 1 is the crude forward price from our report on April 1:
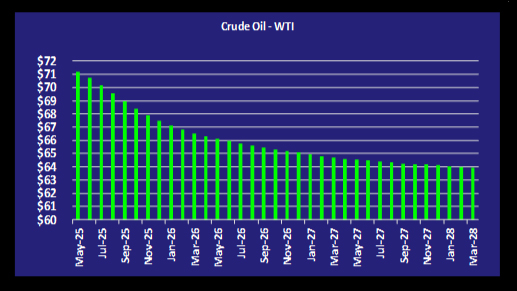
Note how the future prices are lower with each subsequent month. This is commonly called a backwardated price curve. Since the price of propane, especially further out, is influenced heavily by the price of crude, this price structure is generally favorable for propane retailers who want to get price protection over a longer time frame.
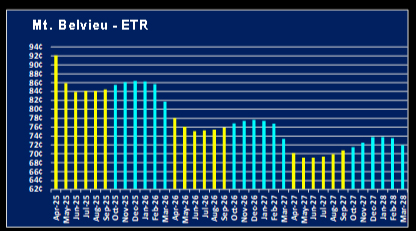
Chart 2 is the forward price curve for Mont Belvieu ETR propane on April 1. There is more seasonality to propane prices, but if you look past that seasonality, you see that the overall shape of the two price curves is similar. In this case, propane fundamentals are greatly impacting the front of the propane price curve. The effect is negative for propane buyers because a tight supply has put a lot of upward price pressure on propane in the front of the curve. That pressure is getting transferred all the way down the curve, though the backwardated crude price curve is helping keep the further-out propane prices lower than the propane prices at the front of the curve.
Let’s now look at the current crude forward price curve in Chart 3:
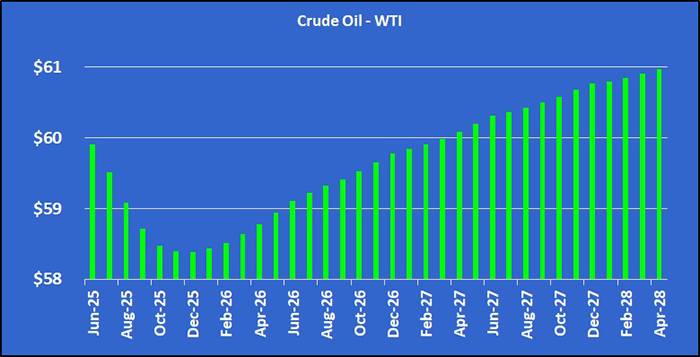
Crude’s price is still backwardated to December, but after that, the next month is priced higher than the month before it. This is called a contangoed price structure.
Now look at propane’s price curve for the same day in Chart 4:
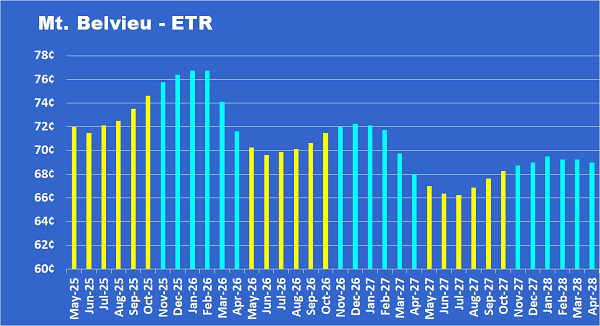
Propane prices have not yet become contangoed. The overall curve structure remains backwardated, but the prices in the front of the curve have come down a lot since April 1. Prices further out have also come down, but they have not come down nearly as much as the front. The contangoed crude price curve is contributing to that development.
Most information you read about commodities price curves will say that a contangoed price curve is normal, which would mean that the change we see in crude’s price curve is a move toward normalcy. The argument that a contangoed curve is normal is that things like inflation and storage costs drive up the future value of a commodity.
But there was a very smart man named John Maynard Keynes who disagreed. He was one of the most influential economists of the 20th century. In his “A Treatise on Money,” written in 1930, he argued that backwardation is the normal price structure in commodities markets.
Keynes argued that sellers of commodities are far more eager to set the price they will get for their commodity further into the future than buyers are to set their cost. The result is that there are far more sellers than buyers the further out you go from the present, which drives the price of the commodity lower further out on the curve.
That means buyer interest is disproportionately concentrated in the front of the curve, which drives the price of the commodity up in the nearby months. This imbalance in buyer and seller interest between the present and future creates what Keynes called normal backwardation in commodities prices.
Look at Chart 1, the April 1 crude forward price curve, and note that WTI crude was just over $71 in the front of the curve. Further note that even at the furthest point out, crude was valued at $64 per barrel. Even though that is $7 below the front-month price, it is still high enough for producers of crude in shale formations to make money. So, producers were still eager to sell their crude at $64, knowing that would ensure they would make an acceptable profit. With the number of interested buyers limited that far out into the future, producers and sellers have to offer a price that will tempt buyers to make a deal.
Now let’s examine the current crude price curve in Chart 3. The price of crude in the front month is below $60. The average cost of producing crude from shale formations in North America is now around $45 per barrel. Sellers will be reluctant to lock in the sell price of their future production as it approaches the $45 mark. Given the magnitude of crude production from shale formations on U.S. crude supply, the $45 price point is crucial in the overall crude market.
Crude has become oversupplied as OPEC+ has added about 550,000 barrels per day (bpd) of production over the last two months and is expected to add 411,000 bpd more in June. In fact, the group is expected to add a combined 2 million bpd to the supply by November. At the same time, there is fear that the tariff war between the United States and China will cause crude demand growth to slow significantly.
So, we don’t think it is a coincidence that crude prices remain backwardated through November. Even though the price has dropped, sellers remain aggressive in trying to sell what they will produce through the end of the year. Producers are accepting the fact that OPEC+ production increases and economic uncertainty will keep pressure on prices through the end of the year.
But once the OPEC increases are finished and more normalcy in trade has evolved, producers are betting the crude supply/demand balance will get tighter, and they will be able to get more for their crude. Therefore, sellers are not being aggressive in selling their future production starting in 2026, which is allowing prices to rise further out. Not many deals may get done further out as a result, but sellers are willing to accept the risk of lower prices to this point rather than locking in a low price for their future production.
What does this mean for propane buyers? It is possible that crude’s price is going to get even more beaten up in the short term. If propane fundamentals improve during this period, specifically ready-for-sale propane inventories, there could be some opportunities presented to propane buyers. The opportunities could be short-lived, but if propane fundamentals improve while crude’s price is beaten up in the front of the curve, there may yet be opportunities for propane price protection at good numbers for the winter of 2025-26.
Propane prices in the further-out months may not come down as much due to crude now being contangoed in the further-out months. That does not mean that opportunities will not present themselves for the further-out months. What it does mean is that we are more likely to see a substantial short-term slide in propane prices for this coming winter than we are for the winters further out. But again, the key to this happening is an improvement in propane fundamentals.
Contangoed price structures tend to occur in oversupplied markets. There have been plenty of those since the shale revolution. Crude markets have often found themselves oversupplied since producing from shale formations became economically viable. But we think that Keynes is right. In normally supplied and undersupplied markets, crude’s prices will tend to be backwardated.
Understanding the impact of crude forward price curves on propane prices and knowing how they evolve and change, flipping back and forth from contangoed to backwardated, can help propane buyers know where the best values in propane pricing are likely to occur. Sometimes it will be in the front of the price curve, sometimes in the back of the price curve.
There are few rules in this business of hedging and price protection that will apply all the time. Perhaps this rule is a certainty: You can’t play the present based on the past. We must evaluate the present data and base our decision today on what it is telling us. Tomorrow we will have to reevaluate. Consider what we just showed as confirmation of this rule. Look how much the crude forward price curve changed in a month. That change has shifted where the opportunities for propane buyers are most likely to occur.
All charts courtesy of Cost Management Solutions
To subscribe to LP Gas’ weekly Trader’s Corner e-newsletter, click here.
You May Also Like
-

2026 LP Gas Rising Leader: Gabe Jones
Feb 27, 2026 -

Faces & Places: February 2026
Feb 24, 2026


Subscribe to LP Gas
If you enjoyed this article, subscribe to LP Gas to receive more articles just like it.