How supply impacts propane inventory levels
Trader’s Corner, a weekly partnership with Cost Management Solutions, analyzes propane supply and pricing trends. This week, Mark Rachal, director of research and publications, addresses the fundamental drivers of propane inventory levels.
In last week’s Trader’s Corner, we began a two-part series on propane fundamentals. We started by looking at propane demand, and this week, we will be looking at propane supply.
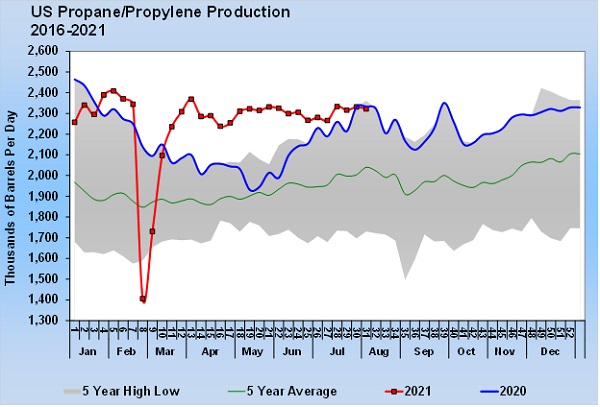
Chart: Cost Management Solutions. Click to expand.
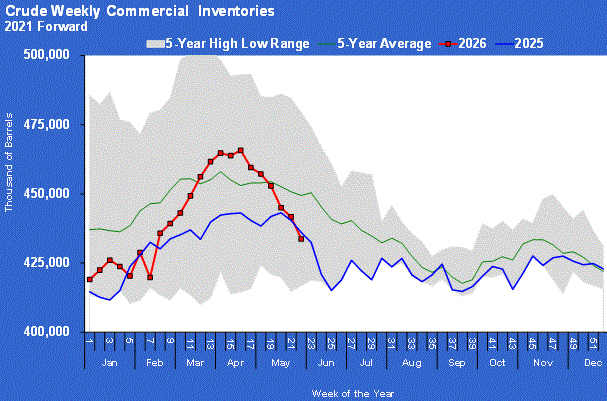
Our premise is that there is a lot of focus on propane inventories, but sometimes looking at the trends in supporting fundamentals may portend changes in inventory before those changes are readily apparent.
Through July 30, U.S. propane inventory was at 20.743 million barrels per day (bpd), 23.9 percent below last year. When numbers start getting that big, it can take a fairly significant change to get our attention.
The Energy Information Administration (EIA) gathers data on propane imports, exports and production. It also gets inventory positions from storage operators. It does not contact propane retailers and other consumers of propane to see how much they used. Instead, it uses the other four components to calculate or imply what domestic demand would have been to result in the inventory positions reported.
Before delving into propane supply, let’s update the demand numbers from last week’s Trader’s Corner to reflect the latest data from the EIA that was collected on July 30. Implied U.S. domestic demand was 956,000 bpd, up 334,000 bpd from the previous week. Through 31 weeks of the year, U.S. domestic demand has averaged 1.242 million bpd, up 97,000 bpd from the same period last year.
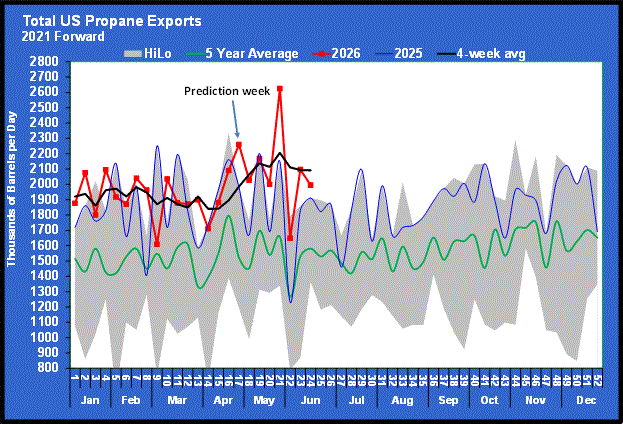
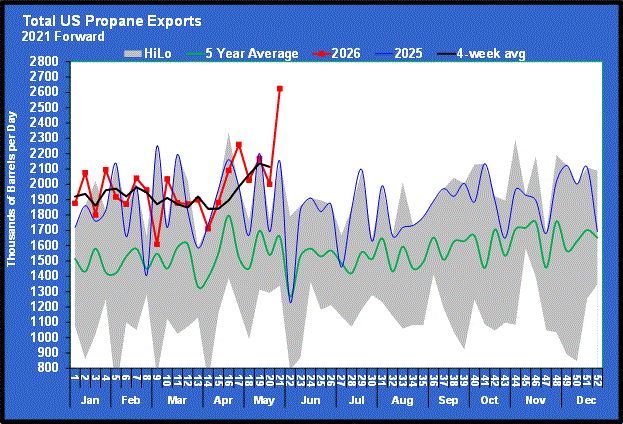
Propane exports fell 299,000 bpd from 1.531 million bpd to 1.232 million bpd. Through the first 31 weeks of the year, U.S. propane exports are up 74,000 bpd over 2020. Combined demand is up 171,000 bpd through the first 31 weeks of 2021. Now, let’s move on to the supply side and see if it is keeping up.
U.S. propane production has averaged 2.256 million bpd this year, up 93,000 bpd from last year. The winter storm in February caused major disruptions to propane production. Other than that, production has mostly been setting five-year highs. In 2020, there was a significant and sustained dip in propane production during the early stages of the pandemic.
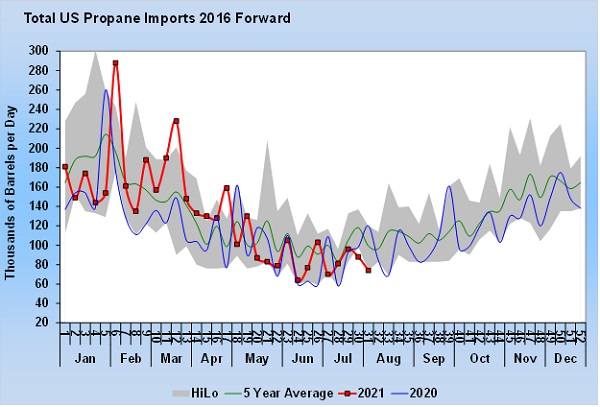
Chart: Cost Management Solutions. Click to expand.
Production had largely recovered by August 2020. Note how production is now very close to what it was last year. This is markedly different from recent years when production would have continued to set new highs with each passing week. U.S. production had reached 2.464 million bpd as an all-time high just before the pandemic. Production remains 142,000 bpd below that peak. In fact, current production is 86,000 bpd below its high for this year, set in February. The trend in production is not to move closer to pre-pandemic levels, but rather to trend away from them.
The other supply piece is imports. So far this year, imports have averaged 132,000 bpd, up 15,000 bpd from the first 31 weeks of last year. Imports were strong at the beginning of the year when Canadian producers had a lot of inventory that had built up during the pandemic. Note, however, that imports have been far less robust since May. Over the last two weeks, imports have set five-year lows for the weeks reported. With Canadian inventories back to average, the need to export to the U.S. appears diminished.
The analysis shows that propane supply is not keeping up with demand. Inventory reflects that fact, as the EIA reports a decline of 9.176 million barrels so far this year. The numbers above would imply an even larger draw on inventory, but that reflects that most propylene is no longer included in propane inventory numbers, but it is included in supply and demand. The data that would allow for us to account for propylene is three months in arrears. The propylene production and demand is fairly steady, so the charts are still a useful tool. The bottom line is that propane inventory is declining, and the underlying data tells us why.
We encourage you to watch the charts we have presented in this analysis, especially the production, import and export charts, in addition to the inventory charts. You will likely see changes in the trends of the underlying charts before changes in inventory. This could give you a leg up in supply price risk management. It could have you making changes to your supply portfolio well before the general market responds to inventory changes.
Call Cost Management Solutions today for more information about how client services can enhance your business at 888-441-3338 or drop us an email at info@propanecost.com.
You May Also Like
-
The US, Iran and propane: A retrospective
Jun 22, 2026 -
Iran peace deal’s impact on propane markets
Jun 15, 2026 -
How the US-Iran war draws on propane inventory
Jun 8, 2026

Subscribe to LP Gas
If you enjoyed this article, subscribe to LP Gas to receive more articles just like it.