One curve to watch: Propane’s relative valuation to crude
Trader’s Corner, a weekly partnership with Cost Management Solutions, analyzes propane supply and pricing trends. This week, Mark Rachal, director of research and publications, evaluates the curves that plot propane values and prices, and discusses how the data might influence propane-buying decisions.
Catch up on last week’s Trader’s Corner here: Is it time to buy propane price protection this winter?
In this week’s Trader’s Corner, we are going to focus on a couple of curves. The first set looks at three-year curves plotting Mont Belvieu propane’s value against WTI crude’s value. The second set shows propane’s three-year price curves. Specifically, we are going to look at the transition in these curves from seven months ago when the current inventory build period began until now. Then, we are going to evaluate what the changes in the curves represent and how that might guide us in propane supply price risk management.
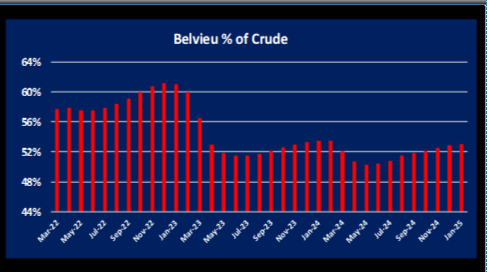
Chart 1: Cost Management Solutions
Chart 1 is the three-year curve of propane’s value relative to crude’s value during the first week of March when propane inventories hit their low and began building for this winter.
The left-hand side of the chart is called the front of the curve, and the right side is referred to as the back of the curve. At this point, propane in the front of the curve was more highly valued than propane in the back of the curve. Now, look at the current curve.
The first chart indicates that the market perceives propane fundamentals, i.e., supply versus demand, to be tighter or less favorable than crude. When supply is considered tight, the market values the propane that is needed now as more valuable than what will be needed in the future. The market assumes that the conditions that are causing the imbalance in supply and demand will correct over time.
Chart
2: Cost Management Solutions
Chart 2 of the current situation shows the script has flipped. Propane in the front of the curve is valued much lower against crude than the back of the curve. That means the market perceive propane to be oversupplied relative to crude. Conditions reflected in the first curve suggest the opportunity is to buy the back of the curve because if the supply/demand conditions do not improve, prices in the back will move toward the front.
If we would have bought the back of the curve in early March, seeing the further-out months as a buy opportunity, we would have wanted to monitor the curve for changes. The transition toward the current curve would have indicated to us that the supply situation for propane is at least improving against crude’s supply situation.
Now, let’s look at propane’s price curve at both points.
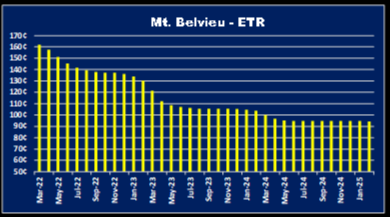
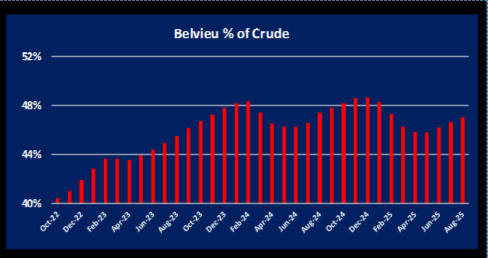
Chart 3: Cost Management Solutions
We are using screenshots from reports for these images, so they are a little out of focus, but we want to look at the shape of the curve, which is easy to see. In Chart 3, the price of propane is much higher in the front of the curve than in the back of the curve. There is about a 40-cent price spread between one end of the curve and the other.
The bottom curve is much flatter, and the price spread is only about 10 cents. Again, if we had been buyers of further-out propane at the time of the first curve, as the shape of the curve changed toward the second one, it would have been a signal to us that propane fundamentals were changing, and we might want to reconsider our position.
There are terms that you hear relating to these curves: backwardated, neutral and contangoed. Chart 1 and Chart 3 are backwardated, meaning the prices or values in the front of the curve are higher than the back. Chart 2 would be a good example of a contangoed curve where values in the front are lower than the back. Chart 4 is closer to a neutral or flat curve.
Chart 4: Cost Management Solutions
How might we use these curves to guide our supply risk management? The curve that stands out to us (looking at it inspired this article) is Chart 2, propane’s relative valuation to crude. We know that over the last five years propane’s average value to crude has been 55 percent and this time of year 60 percent. Currently it’s at 40 percent. We know that markets adjust to imbalances, and the tendency is to move back toward the average.
At the same time, we believe there is plenty of upside price risk for crude. It’s already got a four-month downward price correction behind it, so the downside risk is certainly reduced. If the fundamentals for propane tighten up so that it starts moving back toward its typical valuation relative to crude and crude prices go higher, there is the potential for a sizable move in propane’s price.
We would want to buy the devaluation in the front of the curve. So, we might be more inclined to buy physical propane from our suppliers and put it into storage at this point. We would also be more inclined to buy propane swaps or even options for the nearby months (this winter) rather than future winters. Whereas back in April, we would have been more inclined to own the further-out months.
These charts can be used to help us identify where the buy opportunity may be. They can be used to help manage the positions we already have as well. As the shape of the curve changes, we might want to reevaluate positions we hold. The shape of the curves tells us how the market is perceiving the propane supply/demand situation. As it changes, we may want to increase or decrease our positions accordingly. This is easily done with propane swaps and options.
Another way to play the relative valuation between propane and crude is to buy propane and sell crude. In that play, it really doesn’t matter which way prices move; it only matters if propane’s value improves relative to crude. That can happen in several ways in this scenario. Propane prices could stay the same and crude’s price falls, causing the relative value to improve. The relative value could improve if crude prices stay the same and propane’s price improves. If we just straight up buy propane, then we must have propane prices increase for our position to gain value. But when we play the spread between the two, both propane and crude prices could fall. If crude falls more than propane, our position gains. Then, we see the biggest risk to the play is that both crude and propane will go higher, and crude could outpace the gains in propane for a while.
Playing the valuation spread potentially allows the propane retailer to take advantage of the fact that propane’s Btu is relatively cheap compared to other energy sources without having to be right about the direction that propane prices will move. In many ways, our bias is we should just be playing propane prices to go higher. But if we don’t feel comfortable with that, the price spread play may be something to consider.
We put the current three-year curves for both propane to crude’s relative valuation and propane’s price curve in our daily reports. We realize that when our readers look at these charts every day it’s easy to tune it out. There often isn’t a lot of change day to day. But its value should not be overlooked for both identifying buy opportunities and triggering the reevaluation of our supply positions.
Call Cost Management Solutions today for more information about how client services can enhance your business at 888-441-3338 or drop us an email at info@propanecost.com.
You May Also Like
-
Crude still not out of the woods
Jun 29, 2026 -
Aaron Huizenga on the leadership power of curiosity
Jun 27, 2026 -
The US, Iran and propane: A retrospective
Jun 22, 2026
About the Author: Danielle Pesta
Danielle Pesta was a senior digital media manager at North Coast Media.
Subscribe to LP Gas
If you enjoyed this article, subscribe to LP Gas to receive more articles just like it.