Propane inventories are setting five-year highs
Trader’s Corner, a weekly partnership with Cost Management Solutions, analyzes propane supply and pricing trends. This week, Mark Rachal, director of research and publications, analyzes why propane inventories are still setting five-year highs.
Catch up on last week’s Trader’s Corner here: How hedging differs in the propane industry
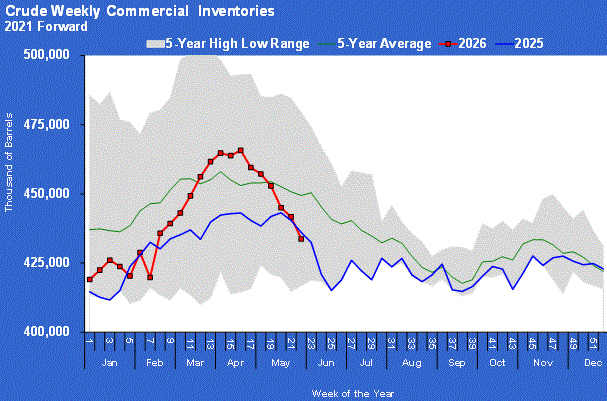
After the Energy Information Administration (EIA) report for the week ending May 19, U.S. propane inventories were still setting five-year highs for this point in the year.
In its May 17 Today in Energy report, the EIA reported something quite startling. It showed that in the core winter months of December 2022-February 2023 domestic demand for propane averaged 32.121 million barrels per month. For those same months in 2021-22, the monthly average was 44.576 million barrels. That is a year-over-year decrease of 12.455 million barrels per month, or a 27.94 percent drop.
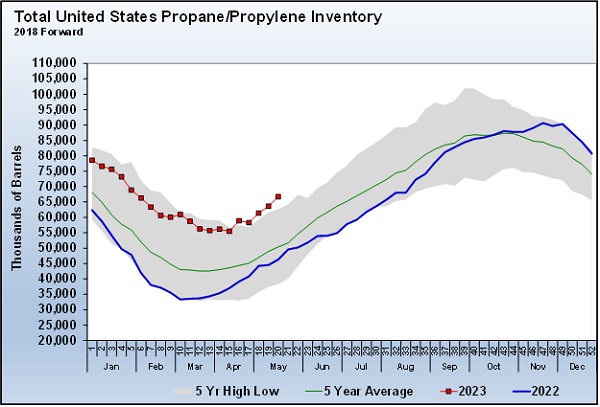
Chart 1: Total U.S. Propane/Propylene Inventory 2018 Forward (Click to enlarge.)
Perhaps even more remarkable was the monthly average during those months for the past 12 years had been 42.567 million barrels, and the lowest average had been 40.558 million barrels during the winter of 2010-11. The mild winter was identified as the cause of the difference.
However, the winter of 2011-12 had fewer heating-degree days (HDD), according to the data referred to in the study, than this past winter, but demand still averaged 40.558 million per month during the three core winter months, more than 8 million barrels above this past winter.
The heating-degree data we follow had total U.S. population weighted HDD 3 percent higher from July to present than the same period the previous year. That has had us questioning for months now whether the mild winter could have been the total cause of the massive difference in domestic demand. We decided to look deeper into the HDD data referred to in the EIA study. For the entire U.S., its data shows HDD this winter up about a half percent over last winter.
There were major increases in the Mountain and Pacific regions which were key reasons the HDD this past winter were higher than last winter. In the EIA report, it said that the Midwest and Northeast accounted for 54 percent of the 6.3 million households that report using propane as their primary space heating source. Therefore, we looked at HDD for just those areas and found combined HDD were 3.1 percent lower during this winter compared to last winter. The worst case on HDD was when we included the southern region with the Midwest and Northeast and excluded the Pacific and Mountain regions, but even that yielded only a 3.6 percent decline in HDD.
If only a weak winter is to blame for a massive fall in demand, a 3.6 percent decline in HDD had to yield a 27.94 percent drop in year-over-year core winter propane demand. We reviewed our fourth grade math book, the highest level we have been able to fake mastery, and still couldn’t make sense of it all.
This review kept our theory that it was stress on household budgets in addition to the mild winter and less petrochemical demand that resulted in the exceptionally large drop in propane demand that, frankly, we are still seeing. We are going to provide some data on propane storage that we believe will help support our claim.
But before we do, here is why it matters. If all the decrease in demand was due to the mild weather last winter, then the cake is baked, and we don’t have to worry about it any longer. That potential demand is simply lost. However, if tight household budgets caused consumers to hold less propane in their tanks, then there is a deficit that will likely be removed when demand increases, and household budgets are under less stress.
We are going to look at storage in the entire propane supply chain to illustrate our point. The data we have on propane storage is dated, so we want to show Chart 2 first.
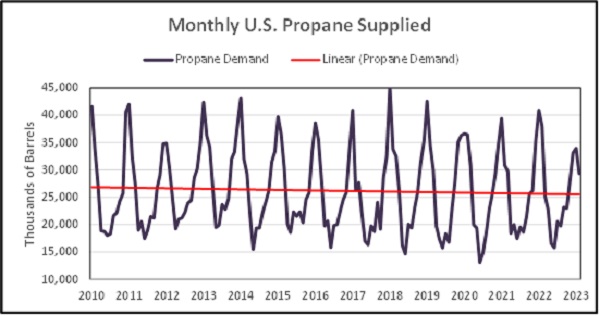
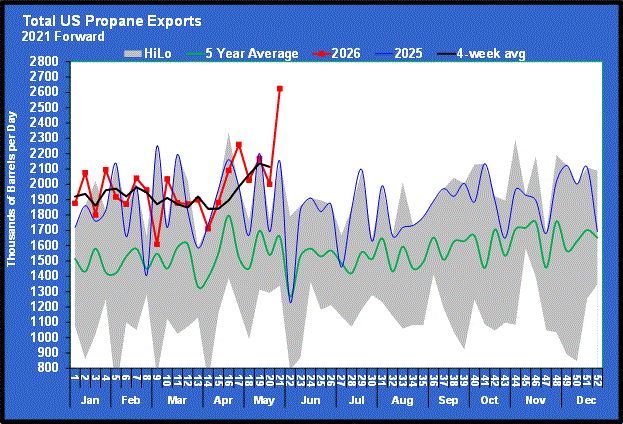
Chart 2: Monthly U.S. Propane Supplied (Click to enlarge.)
Chart 2 shows monthly propane demand since 2010 according to the EIA. They call it products supplied which, is the equivalent of domestic demand. Note how demand hasn’t changed much and if anything, there is a slight decline. We show this because we are using data on storage provided in a 2014 study from the National Propane Gas Association (NPGA). Because demand hasn’t changed much, we believe the data on consumer storage is going to be similar as well.
In the NPGA report, it identified propane storage at the consumer level at 111 million barrels. It has storage at the retailer level about 1/9th that amount, or 12 million barrels. Primary storage at the hubs at 123 million barrels. Primary storage for propane at bulk storage facilities and refineries is now about 194 million barrels. It is propane in primary storage that is used by the EIA as part of the calculation for demand.
The important number for our discussion is the amount of consumer level storage of 111 million barrels. If consumers are holding just 10 percent less propane in tanks right now than normal due to budgetary constraints, it would account for 11 million barrels of the 20.4 million barrels that current primary propane inventories are over where they were at this point last year. Based on industry data, we see petrochemicals have consumed about 6.2 million barrels less over the last 12 months than the previous 12 months. The weaker winter would account for about a million barrels of the extra inventory. Combined with petrochemicals, that is 7.2 of 20.4 million barrels of extra inventory this year. That means that consumers would only need to be holding their tank levels about 12 percent less than normal to account for the remaining 13.2 million barrels in primary propane inventory this year versus last year.
Again, if this is the reality, then when consumer budgets are less tight and demand returns, consumers will likely gravitate to holding a more normal level of propane in their tanks. We will predict that if consumer prices continue to come down over the summer and basics like food and fuel are at more normal price levels and winter weather is simply normal, that there will be higher calls on propane from primary inventories to start the winter of 2023-24. If prices have not come down, or demand is below average, we may not see it, but at some point, this possibly lower level of consumer inventory will be made up. If this theory is correct, we could see a little extra upward pressure on propane prices this coming winter.
All charts courtesy of Cost Management Solutions.
Call Cost Management Solutions today for more information about how client services can enhance your business at 888-441-3338 or drop us an email at info@propanecost.com.
Related content:
You May Also Like
-
The US, Iran and propane: A retrospective
Jun 22, 2026 -
Iran peace deal’s impact on propane markets
Jun 15, 2026 -
How the US-Iran war draws on propane inventory
Jun 8, 2026

Subscribe to LP Gas
If you enjoyed this article, subscribe to LP Gas to receive more articles just like it.