Reactions to record low US propane demand
Trader’s Corner, a weekly partnership with Cost Management Solutions, analyzes propane supply and pricing trends. This week, Mark Rachal, director of research and publications, discusses U.S. propane demand reaching a record low.
Catch up on last week’s Trader’s Corner here: Is it a good time to buy propane?
The U.S. Energy Information Administration (EIA) started calculating domestic propane demand in April 2004. For the week ending May 5, it reported the lowest domestic demand during that entire span.
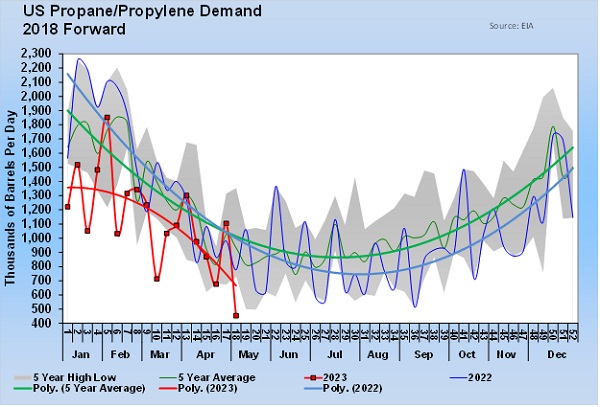
Chart 1: U.S. Propane/Propylene Demand Click to enlarge.
The EIA reported total U.S. demand at just 454,000 barrels per day (bpd). That was down 651,000 bpd from the previous week, and a substantial 323,000 bpd from the same week last year.
Industry data shows U.S. petrochemical demand for propane at 220,000 bpd. That puts commercial demand at 234,000 bpd. That is less than the equivalent of 1,000 transport loads per day nationwide.
The EIA does not solicit reports from retailers on demand. They do obtain reports on propane inventory, propane imports and exports, and propane production. With those numbers in hand, the EIA can calculate implied demand. If someone makes a reporting error in any of those areas, it impacts the demand calculation.
Because demand is very volatile, we put trend lines in Chart 1 to make it easier to compare. When you see changes in demand of 651,000 bpd from one week to the next, it’s not hard to wonder if a reporting issue is in play. However, we do know that the Dixie Pipeline went down for maintenance on May 1. There could have been inflated demand the week before as retailers prepared for that event, and of course, the shutting of the pipeline could have contributed to the unusual drop in demand.
We are inclined to take the number reported at face value largely because it is not out of line with the prevailing trend in domestic demand. So far this year, U.S. domestic demand is running 359,000 bpd less than it did during the same period in 2022. During that time, demand from petrochemicals is 35,000 bpd less than it was a year ago. That means that commercial demand is down 324,000 bpd.
The first reaction is to attribute the drop to a very mild winter, but the data doesn’t support that assumption.
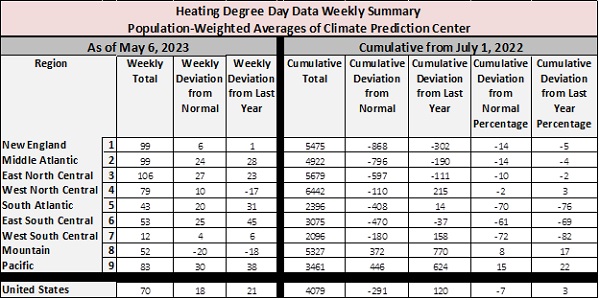
Chart 2: Heating Degree-Day Data Weekly Summary / Population-Weighted Averages of Climate Prediction Center Click to enlarge.
Chart 2 shows population weighted heating degree-days for the total U.S. and by region. Since July 1, 2022, there have been 4,079 heating degree-days on a national average. That is 120 days, or 3 percent, higher than in the same period a year earlier.
We do believe there was increased demand for propane during the pandemic as people stayed home and likely used more propane at their residences than they would at school or work. That increased demand would certainly be coming off now. But, we don’t believe that could possibly account for anywhere near 324,000 bpd of propane consumption.
We have also put forth the idea that tough times for consumers could be at play. Inflationary pressures are taking a chunk out of household budgets. Consumers could be allowing tanks to run low and allocating funds that would have gone to refill their tanks toward food and other necessities. Again, this is only a thought since we have no data to back it up. The same could be said about our assumption on increased demand during the pandemic. They are educated guesses at best.
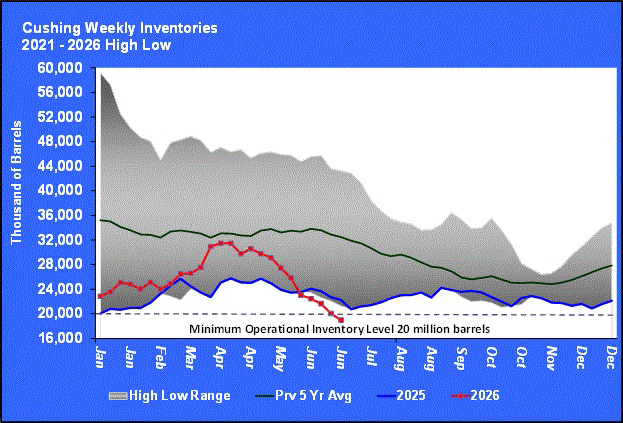
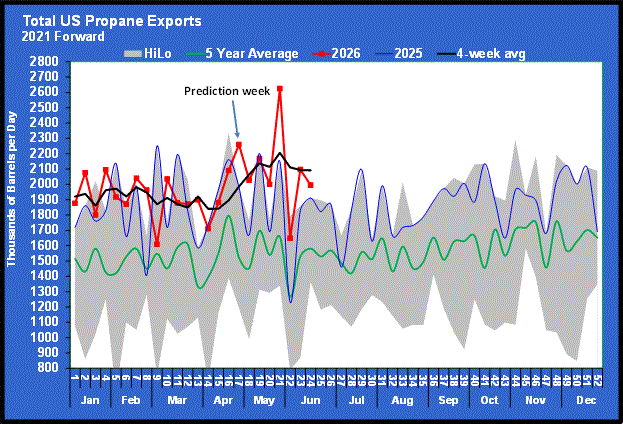
Frankly, all through this past winter, we expected large draws on primary storage when strong cold fronts moved across the nation. But draws on inventory never got unusual. Perhaps the only supporting evidence might be the fact that the inventory draw-down period hung on a little longer this year than usual. The low inventory position for the year on average happens during week 12 of the year. As of now, it looks like the low inventory position for 2023 was established during week 15. But even that feels more like the result of extremely robust exports, which recently set a record.
This unexplained drop in domestic commercial demand is like a Bermuda Triangle story for us. You know, the two-hour documentary that finishes with more questions than answers as to what happened to some ship or plane that went missing in that area. Those shows leave us so frustrated. They repeat the whole narrative after every commercial break, then ask one more unanswerable question before slipping away to the next commercial break. We will admit to doing the same thing as we have written about the loss of domestic demand this year. And yet here we are a week after record low domestic demand was reported, staring blankly into the abyss.
All charts courtesy of Cost Management Solutions
Call Cost Management Solutions today for more information about how client services can enhance your business at 888-441-3338 or drop us an email at info@propanecost.com.
Related content:
You May Also Like
-
Crude still not out of the woods
Jun 29, 2026 -

Aaron Huizenga on the leadership power of curiosity
Jun 27, 2026 -
The US, Iran and propane: A retrospective
Jun 22, 2026


Subscribe to LP Gas
If you enjoyed this article, subscribe to LP Gas to receive more articles just like it.