Propane inventory drawdown nears an end
Trader’s Corner, a weekly partnership with Cost Management Solutions, analyzes propane supply and pricing trends. This week, Mark Rachal, director of research and publications, reviews propane inventory changes and weather pattern shifts.
Catch up on last week’s Trader’s Corner here: Refineries make less fuel-use propane
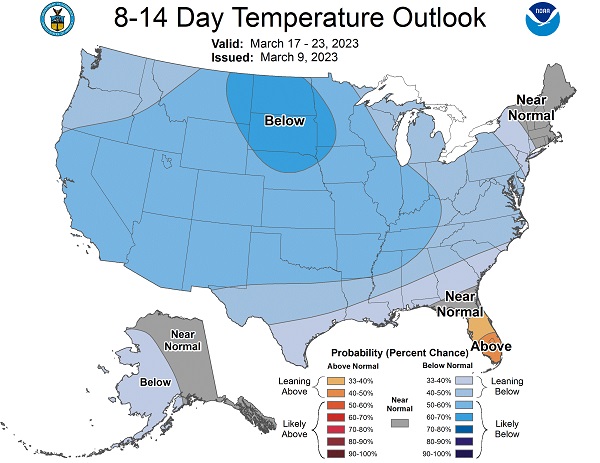
The National Oceanic and Atmospheric Administration (NOAA) temperature probability maps are showing the likelihood that temperatures will be below normal for much of the remainder of this month. But that possibility has not prevented propane prices from losing about 10 cents last week. We’re at that point in the year, and inventories are in a position where traders tend to shrug off weather as a potential mover of the market.
The temperature probability map covers March 17-23. The blue color indicates higher probability for below-normal temperatures. If there were any tightness in propane supply, this might be enough to put a little upward pressure on prices. But this year, inventory is too high for that to happen.
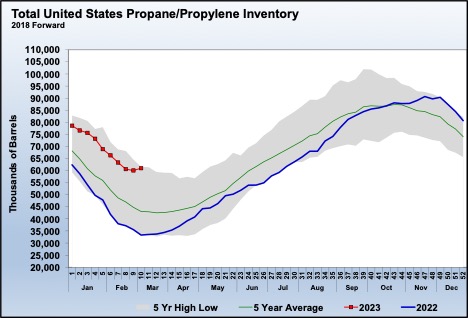
For the week ending March 3, the Energy Information Administration reported just a 537,000-barrel draw in U.S. propane inventory. Expectations were for a 1.84-million-barrel draw, and the five-year average for week nine of the year had been a 2.042-million-barrel draw. Inventory stands at 60.053 million barrels. That is 24.523 million barrels, 69 percent, higher than last year and 33.1 percent above the five-year average.
It was yet another below-average draw on inventory. It has been a common occurrence this year and the reason inventory is near the five-year high for this time of year. Traders know the end of the inventory drawdown period is near.
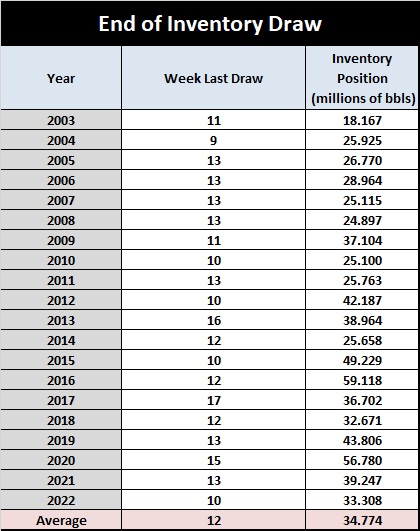
Chart 2 shows the week of the final draw of the year and the inventory position after that draw.
As Chart 2 shows, we are now in the window where the final inventory draw of the year occurs. The range is from week nine to week 17, with the average at week 12. The way it is trending this year, it feels like a year when the final draw will occur earlier in the window.
Since 2003, the average end-of-drawdown inventory position is 34.774 million barrels. Things have changed a lot during that time in terms of production and imports/exports that the trend is to have more inventory at the end of winter. For example, the average over the last five years has been 41.162 million barrels.
Perhaps the more important number, since inventory is so high, is how this year’s inventory compares to the highs of the past. The highest end-of-winter inventory position was 59.118 million barrels in 2016. If week nine this year turns out to be the last inventory draw, it will set a new high end-of-winter inventory position.
So, it has been with little surprise that propane prices started dropping last week and are on pace to give up at least 10 cents over the course of the last five days. A rally in crude had delayed the fall in propane prices, but the crude turned lower last week too. With rising crude, it is hard to see a way higher for propane given the current fundamental situation.
The current situation bodes well for buyers, at least in the short term. We have spent some ink in Trader’s Corner pointing out areas that could change and cause propane fundamentals to tighten up. There is also the potential for crude to ultimately carry propane prices higher. But for now, it looks like there could be a good opportunity window for buyers over the next two to three months.
Call Cost Management Solutions today for more information about how client services can enhance your business at 888-441-3338 or drop us an email at info@propanecost.com.


