Looking forward to next winter and beyond
Join Cost Management Solutions for a free 30-minute Virtual Hedging webinar on Wednesday, May 29 at 10 a.m. CT. Register here.
Trader’s Corner, a weekly partnership with Cost Management Solutions, analyzes propane supply and pricing trends. This week, Mark Rachal, director of research and publications, evaluates strategies to prepare for the 2024-25 winter.
Catch up on last week’s Trader’s Corner here: Natural gas production slowing
Just outside our office door, birds are chirping, flowers are blooming and trees are leafing out. Spring is upon us. For the week ending April 6, there were 105 heating-degree days (HDDs) on a nationwide population-weighted average, but, for the most part, we can close the books on the 2023-24 winter.
It was not a particularly good winter if your livelihood depends on selling Btus. Since July 1, there have been 3,612 HDDs. That is 479 HDDs, or 12 percent, below normal. The tally is running 192 HDDs, 5 percent, below last year.
But hope springs eternal, and propane retailers will now turn their attention to preparing their supply portfolios for next winter and beyond. With the recent pullback in prices, values look better for the winter of 2024-25 but still a little pricey. Pricing for the further-out winters looks better. Remember, you can use forwards/swaps to fix supply costs for up to three years out. Right now, a retailer could fix prices for the next three winters.
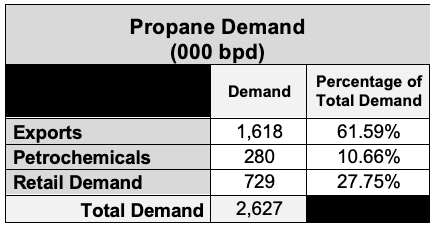
As we have recently discussed, with propane exports now constituting 62 percent of total U.S. demand, the seasonal patterns on pricing are no longer as distinct nor as reliable as they once were when retail demand was the bulk of overall demand.
Nevertheless, between now and the end of June, we should expect some of the best propane values based on history. Over the past five years, front-month propane has averaged around 74 cents during May and June. April has averaged around 78 cents, so the odds favor putting our plans together over the next couple of weeks and begin executing them in the upcoming couple of months.
In case you are wondering which month has averaged the lowest price over the past five years, it has been December at around 71 cents. December has also averaged the lowest over the past 10 years, so it is a more consistent pattern than you might think. In general, there tends to be higher prices during the fall, during the hype and buildup to winter, and in the final three months of winter when supplies can get a little more stretched if there is good heating demand.
Of course, every year is different. There have been some Decembers with very high prices – though most of those high Decembers happened more than 10 years ago. As you make your buying plans, don’t forget that December may offer an opportunity to place some hedges for the last three months of winter. Odd, but true.
But let’s focus on the buying plan for a propane retailer that will be executed over the next couple of months. The first consideration is how much pre-buying or hedging should a retailer do. It probably shouldn’t be the same every year. Unless a retailer can have a commitment from buyers for all of their sales at a fixed price, it shouldn’t be anywhere near 100 percent of expected sales.
Hedges of around 40 to 60 percent of sales could be considered by some companies to be appropriate. Currently, we are in a pattern of weak winters. Propane production is high, and inventories are in good shape. So going into this buying season, the company above might want to be at the lower end of the range at around 40 percent. They will need to read the tea leaves throughout the year. If it appears that the supply/demand balance is going to be tighter than it looks right now, they could lock the price on more supply.
For now, 40 percent seems like a good target for this example, but each company’s needs will be different. We can’t know everyone’s specific needs, so there is some generalization throughout this discussion.
At that volume, if prices are higher than expected, it is enough to help average down and protect our customers. If prices are lower than expected, this volume will average our price up, but not so much as to make us uncompetitive. Let’s say our business sells a million gallons between September and April; those are going to be the higher volume months for the business, and over the years, those are the eight months with the highest price. And given the oddity of December, we might focus on September through November and then January through April. A retailer would look at sales volumes across the time frame and set volume targets for each month based on the actual sales history.
The next consideration is what tool to use to fix the future price. The plan is to buy 400,000 gallons to cover September through April. If you have a lot of storage, it should be in the mix, but for most retailers that is not the case. Most of us just have working storage that doesn’t represent enough of the overall hedge plan to make a difference. So, for most, the “tool” choices will be forwards (swaps) and pre-buys.
Both of those tools have their place and should be in our supply portfolio because they each have strengths and weaknesses. Forwards or swaps are very easy to get into and often can lock in a price at a lower cost than a pre-buy. The position can also be easily closed. If the outlook turns bearish for prices, the buyer could implement forward or swap sales to essentially close some or all of the hedges.
Their weakness is that the volume is month-specific. Therefore, they are best used as the base load of our hedging program. We should not over-hedge with swaps and should restrict the volume to what history shows as our lowest sales volume for the month that is being covered. Let’s say history shows our lowest sales volume in September was 50,000 gallons. Our swap volume should be under that number, all other things being equal.
When we buy swaps to protect against higher prices, they are month and volume-specific. So, in our plan to cover September through April, there would be a minimum of eight different swaps with their specific volume. And this is if we place all hedges at just one point. More likely, we would accumulate the volume we want over several buys, so we may have two or more swaps for each of the months.
Since the swaps are month and volume-specific, they do not consider that monthly volume varies with every winter. That is where the pre-buy from our supplier comes in. We want a non-ratable pre-buy so we can pull the volume as needed over a range of months. This gives us the month-to-month volume flexibility we might need.
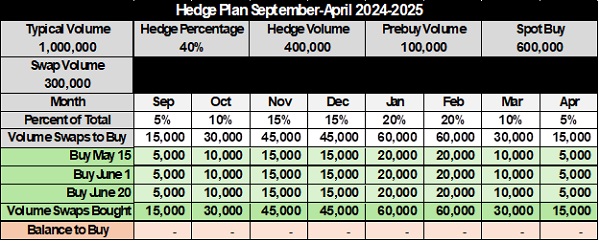
The actual volume you pre-buy should be determined by the amount of variation in sales from winter to winter. A good guideline would be that about 25 percent of our hedge plan should be non-ratable pre-buy. In this case, that would be 100,000 gallons of pre-buy leaving 300,000 gallons of swaps to accumulate as we see fit before the September to April delivery period begins. And remember December; we may even fill out some of the program during the delivery period.
A simple spreadsheet for our hedge program might look something like Table 2.
In Table 2, we capture the assumptions we made in our discussion. We are assuming it is the end of August, just before the delivery period begins. It shows the swaps were filled on three different dates. That means there are 24 swaps active. The September swaps will settle at the end of September when the monthly average is known. That process will repeat through the end of April.
When the swaps were entered on the respective dates above, the buyer would have bought a specific price, known as the strike price, on that swap. The buyer would have had the choice on May 15, for example, to have each of the eight months priced individually or gotten an average strike price across all eight months. That is commonly referred to as a strip price. However, it’d still be eight swaps, one for each month.
At settle, the strike or buy price of each swap will be compared to the monthly average. If the month average is higher, the buyer will get the difference. If the monthly average is lower, the buyer will pay the difference. Let’s say the strike price for the September swap, which was bought on May 15, was 75 cents. If the month averaged 78 cents, the buyer would receive 3 cents for each gallon, or $150 for that swap. This settlement would occur at around Oct. 1 for the September swaps.
In the case of the spreadsheet, if next year’s conditions warrant a 50 percent hedge program, we change the 40 percent to 50 percent, and the spreadsheet adjusts accordingly. Of course, you can make your own as simple or as complicated as you would need it.
We want to reiterate this is just an illustration. Every company’s situation is different, causing significant variances in the numbers in actual practice. However, the concept would be the same regardless of volumes, risk tolerance or market view.
All tables courtesy of Cost Management Solutions
Call Cost Management Solutions today for more information about how client services can enhance your business at 888-441-3338 or drop us an email at info@propanecost.com.


