Propane market reaches normalization
Trader’s Corner, a weekly partnership with Cost Management Solutions, analyzes propane supply and pricing trends. This week, Mark Rachal, director of research and publications, explains why the propane market has gone from abnormally bearish to more normalized despite the recent decline in inventories and the rise in prices.
Catch up on last week’s Trader’s Corner here: Propane inventory posts largest draw on record
In last week’s Trader’s Corner, we discussed the record-setting propane inventory draw for the week ending Jan. 19. A severe winter storm not only caused more demand but also disrupted supplies. Things had not returned to normal by Jan. 19, and we feared another above-average draw when data was collected on Jan. 26 for the U.S. Energy Information Administration’s Weekly Petroleum Status Report released on Jan. 31. That was the case.
Mont Belvieu ETR propane was up 20 cents, or 28.73 percent, and Conway 18.5 cents, or 26.91 percent, in January. Both have continued higher in February with the inventory draws in support.
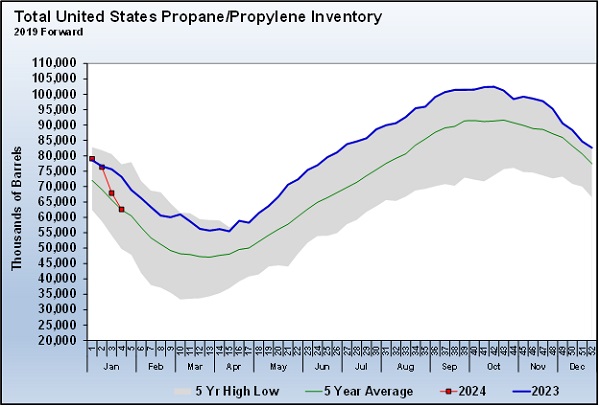
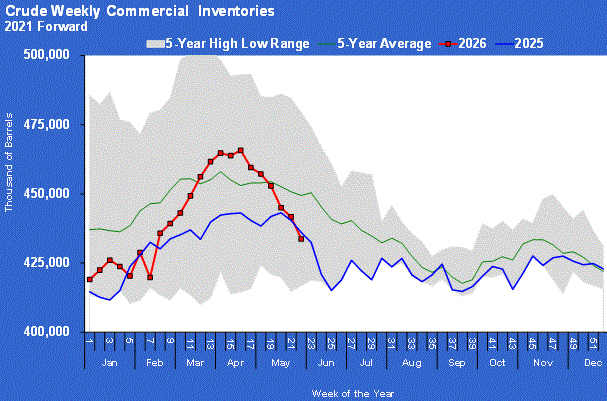
Chart 1: Total U.S. Propane/Propylene Inventory 2019 Forward
If one is normally a propane buyer, like retailers are, this all feels bad, ominous, foreboding. But as the U.S. propane inventory Chart 1 illustrates, the winter storm returned long-running high inventories, that were setting five-year highs most of last year, to normal levels.
When propane prices increase as much as they did in January, it feels like the market is getting away from a buyer. But are prices getting away from buyers, or does it just feel that way? The fact is that propane markets have remained tame through this inventory adjustment process.
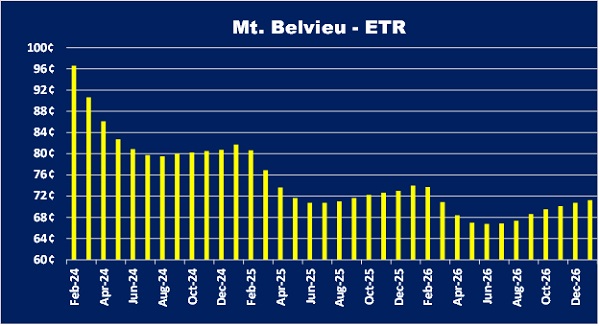
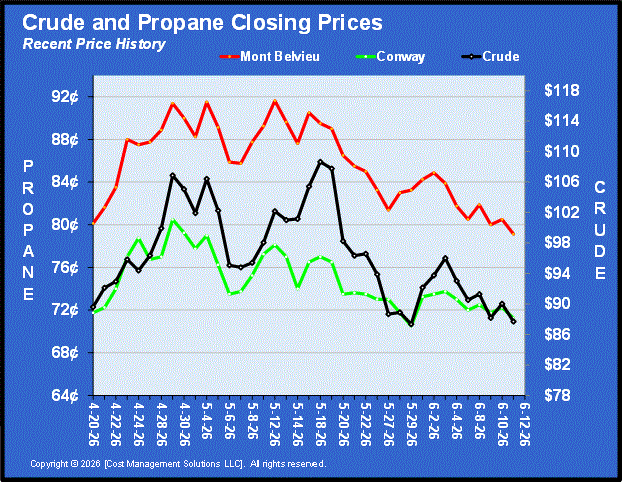
Chart 2: Mont Belvieu ETR
Chart 2 is the forward price curve for Mont Belvieu ETR propane. A forward price curve is not a prediction of where prices will be in the future. This is a three-year price curve, and it reflects where the market currently values propane in each of the next 36 months.
Note how the market prices propane needed soon a lot higher than it values propane needed in the future. This is known as a backwardated pricing environment and is typical in a normally supplied market. In the case of the current pricing environment, the front months (nearest to the current month) are strongly backwardated, which suggests short-term supply tightness. The sharp backwardation means the market is pricing propane as if the current supply tightness will resolve quickly.
As propane buyers, we would like to avoid being buyers of February propane if we can. This is a case where having a prebuy or a forward (financial) position would be helpful. But what about prices further down the curve? Has the market gotten away from the buyer?
Currently, a retailer could buy an October 2024-March 2025 strip of propane forwards at an average price of around 80 cents per gallon. The same strip in Conway is about a penny higher. On this date last year, the strike price of that same winter strip was priced at 90 cents at Mont Belvieu ETR and 91 cents at Conway.
So, despite all of the craziness with the winter storm, resulting in a decline in inventories and sharply rising prices in January and into February, a retailer could still lock down next winter propane for about 10 cents less than last year at this time even though propane inventories are currently 14.5 percent lower. That would indicate that, while pricing is crazy in the current month, propane valuations overall have remained quite calm.
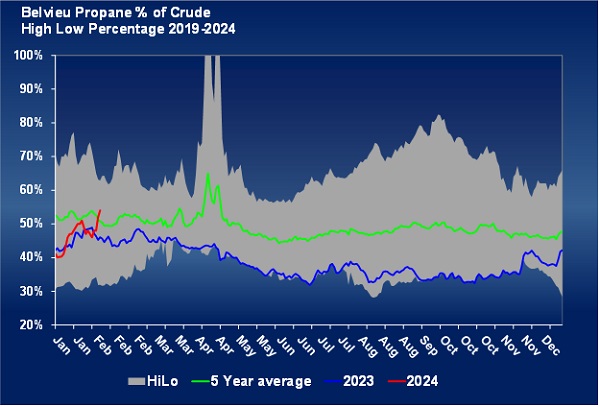
Chart 3: Belvieu Propane % of Crude High Low Percentage 2019-24
Traders Corner’s readers see Chart 3 regularly. It is such a good indicator of the strength or weakness of propane fundamentals. Even with all of the inventory decline and price gains lately, propane is still valued only slightly above normal for this time of year. Chart 3 plots the value of front-month propane against the value of front-month West Texas Intermediate (WTI) crude.
If we look further out, propane’s value relative to crude is normal to below normal.
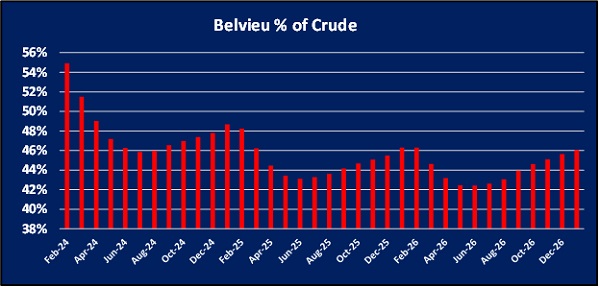
Chart 4: Belvieu % of Crude
Chart 4 plots the values on the forward curve for propane prices against the value of WTI’s forward price curve. If you look at next winter, propane’s value relative to crude is below normal at around 47 percent, and for the winter after, around 45 percent.
The point is that despite the recent decline in inventories and the rise in prices, the market has simply gone from abnormally bearish to more normalized. As a buyer, it is normal to feel like prices have gotten away from you given what has happened recently but, rest assured, they have not.
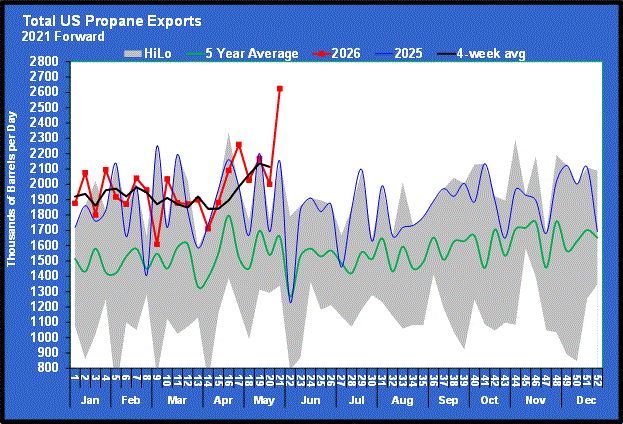
Propane production will be very high over the summer, and inventories will replenish. But one thing that has changed is the need for price protection. When inventories were setting five-year highs a few weeks ago, our interest in price protection for next winter was less. But now it has increased.
If hedging 50 percent of our needs next winter is the benchmark, we might have thought about hedges close to 30 percent for next winter a few weeks ago. Today, our thinking would be closer to the benchmark 50 percent since things have normalized. These numbers are always moving targets based on the latest developments in the market. But as we explored recently, one of the greatest strengths of forwards is the ability to adjust our hedge position quickly.
All charts courtesy of Cost Management Solutions.
Call Cost Management Solutions today for more information about how client services can enhance your business at 888-441-3338 or drop us an email at info@propanecost.com.
Related content:
You May Also Like
-
Iran peace deal’s impact on propane markets
Jun 15, 2026 -
How the US-Iran war draws on propane inventory
Jun 8, 2026 -
Global LPG supply flows change dramatically
May 26, 2026

Subscribe to LP Gas
If you enjoyed this article, subscribe to LP Gas to receive more articles just like it.