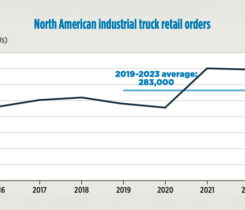
Propane Market Metrics: North American industrial truck retail orders
June 15, 2025 By LP Gas
The Industrial Truck Association unveiled the results of an economic impact analysis conducted by Oxford Economics, underscoring the…
Read More
The Industrial Truck Association unveiled the results of an economic impact analysis conducted by Oxford Economics, underscoring the…
Read More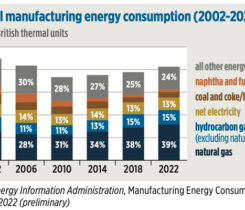
EIA data shows an increase in US manufacturing energy consumption.
Read More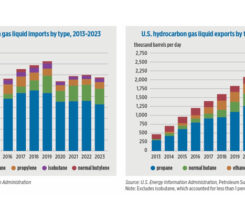
Examine U.S. Energy Information Administration data of U.S. hydrocarbon gas liquid imports and exports.
Read More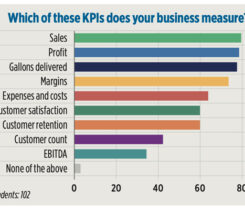
See highlights from Cargas’s 2025 Top Technology Trends in Fuel Delivery Benchmarking Report.
Read More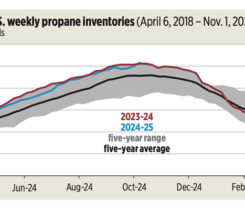
The U.S. was well stocked with propane heading into the 2024-25 winter heating season, according to U.S. Energy Information Administration data.
Read More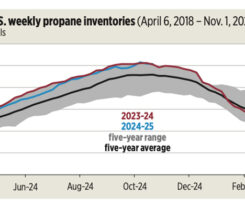
U.S. propane inventories were at the top of the five-year range spanning the winter of 2019-20 to the winter of 2023-24.
Read More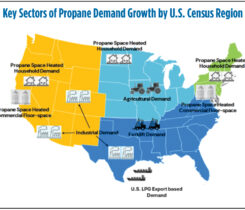
Propane is a versatile energy source across the U.S., with its utilization influenced by regional needs and infrastructure.
Read More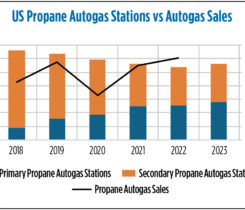
ICF explores U.S. autogas consumption trends from 2018 to 2022, along with changes in autogas vehicles and station counts.
Read More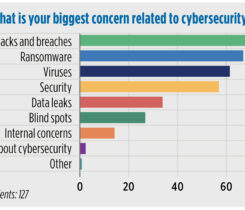
Fuel delivery companies say hacks and breaches, ransomware, viruses and security create the biggest cybersecurity concerns for their operations.
Read More