Back to backwardation for crude
Trader’s Corner, a weekly partnership with Cost Management Solutions, analyzes propane supply and pricing trends. This week, Mark Rachal, director of research and publications, explains why fundamentals are not the only thing impacting commodities trading.
Catch up on last week’s Trader’s Corner here: Propane market reaches normalization
Over the past couple of Trader’s Corners, we have focused on the impacts of the record draw on propane inventories. When that happened, it essentially dictated our Trader’s Corner subject. When such an event occurs, it must be considered.
Just before that occurred, we had planned to discuss a change to the forward price curve for West Texas Intermediate (WTI) crude. It’s fortuitous that our discussion of the subject has been delayed. Events over the past couple of weeks reinforce the points we wanted to make on the subject.
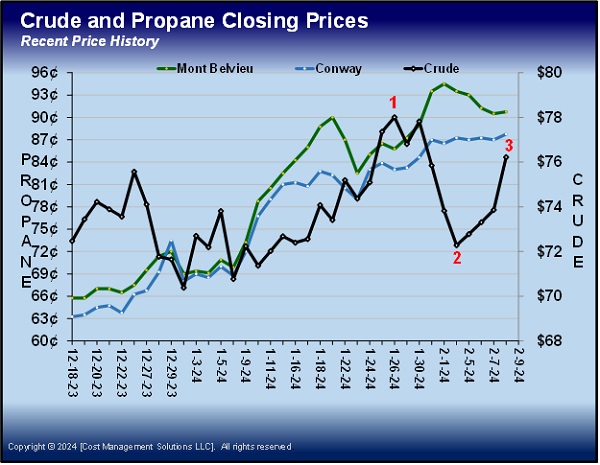
Let’s begin by identifying key points in the discussion with a chart that plots recent closing prices of WTI crude, Mont Belvieu ETR propane and Conway propane. We will focus on the black crude line in Chart 1.
At the end of January (position 1 on Chart 1), crude prices peaked after a long run. The rally in crude was largely due to threats to supply coming from the Middle East. The core driver of prices has been the war between Hamas and Israel in Gaza. But that has spawned other issues that are perhaps even more threatening to supply.
Hamas is an Iranian-backed group, and other such proxies began attacks in support of Hamas. Iranian-backed Houthis in Yemen began attacking shipping in the Red Sea. A U.S.-led coalition responded with naval forces to defend shipping. Even so, many ships stopped using the Red Sea and the connecting Suez Canal in favor of safer, albeit much longer, shipping routes. Struggling to defend the shipping, the U.S.-led coalition went on the offensive, attacking Houthi facilities in Yemen.
Iranian-backed groups in Syria and Iraq stepped up attacks on U.S. military facilities in the region that eventually led to the deaths of three U.S. service members and the wounding of scores more. The U.S. has responded by attacking known facilities of those groups.
In early February (position 2 on Chart 1), crude prices had retreated after Israel proposed a ceasefire in Gaza. Hamas considered it for several days and then offered an alternative agreement, which Israel flatly rejected. While Hamas considered the ceasefire, crude prices fell. But as the hope of a ceasefire waned, WTI crude rallied again to position 3 on the price table of Chart 1.
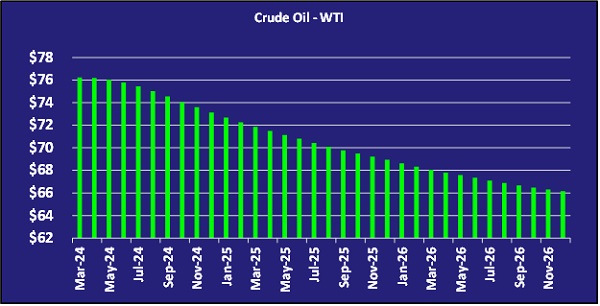
Chart 2 is the current forward price curve for WTI crude. For the sake of space, we do not put up the forward curve for the end of January (position 1). It is practically a duplicate of the one above. Crude’s price and forward curve have come full circle between positions 1 and 3 on the price table.
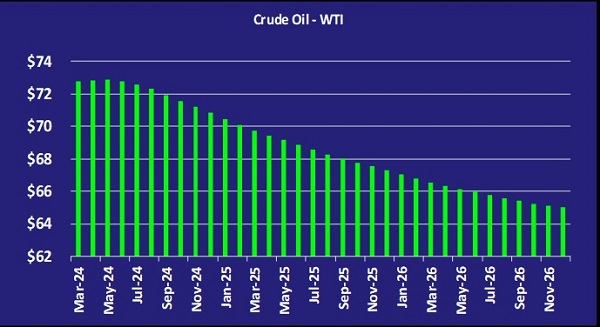
Chart 3 shows the WTI crude forward price curve when prices were at position 2 on the price table.
At first glance, it might not look like there is much change. In fact, from May forward, the shape of the curve is the same. The difference is contained in the first two months.
The top curve is backwardated, meaning each month is priced less than the month that precedes it. When prices are backwardated, supply and demand are considered balanced or tight. In those conditions, the crude that is needed now or sooner is more valuable than the crude needed down the road.
When the geopolitical issues in the Middle East dominated as they did at the end of January, there was more concern about crude supplies, which drive up the price in the front of the curve. The current price curve once again reflects those concerns.
When it looked like a ceasefire in Gaza might occur, the market became less concerned about crude supplies and focused more on the threats to demand in the form of weak economic conditions. The market reflected that, if the threats to supply go away, there would be a surplus of crude. When there is a surplus of crude, prices become contangoed. In the case of contango, the crude needed soonest is valued less than crude needed in months further out. The market always assumes that whatever is driving prices lower will resolve, so the months further out tend to stay up, while the front months come under price pressure.
If the oversupply situation appears to be significant or likely prolonged, then the contango prices will be seen further down the curve, and the difference in value between the months will become more pronounced. Had a ceasefire been signed, there was a good chance the forward price curve would have become significantly more contangoed. That would have been especially true if a ceasefire in Gaza would have led to the Iranian-backed groups ending attacks on shipping and on U.S. military bases.
There are several key takeaways here. Commodities trading can be heavily influenced by far more than fundamentals. Geopolitics and economics play major roles. Because the geopolitical landscape can change so quickly, as demonstrated by the example above, if one “trades” a commodity, they must be equal parts buyer and seller. One cannot take a position either long or short a commodity without a willingness to exit the position (even at a loss) if conditions change.
Though it was not the case over the period we covered in this Trader’s Corner, propane can be heavily influenced by crude’s price movement. During the time covered here, the winter storm had caused issues unique to propane that resulted in it separating from crude. Most of the time propane gets its price direction from crude.
A propane retailer that “trades” a commodity, even if it is propane, must consider the position every single day and act accordingly. However, propane retailers can be hedgers when it comes to propane. That means they can take a supply position, and if they offset it with sales to customers in the form of budget sales, fixed-priced sales or even cap programs, they do not have to be concerned with the whims of the market.
When a business is part of the supply chain for a commodity, it can be a hedger. Those that are not a part of the supply chain can only be speculators or “traders.” But make no mistake, if propane retailers take a supply position and do not have a sale against it, they are speculators/traders and should conduct themselves accordingly.
All charts courtesy of Cost Management Solutions.
Call Cost Management Solutions today for more information about how client services can enhance your business at 888-441-3338 or drop us an email at info@propanecost.com.


