Inventory build resets market
Join Cost Management Solutions for a free 30-minute Virtual Hedging webinar on Wednesday, May 29 at 10 a.m. CT. Register here.
Trader’s Corner, a weekly partnership with Cost Management Solutions, analyzes propane supply and pricing trends. This week, Mark Rachal, director of research and publications, takes a closer look at the current market and the recent inventory build.
Catch up on last week’s Trader’s Corner here: Looking forward to next winter and beyond
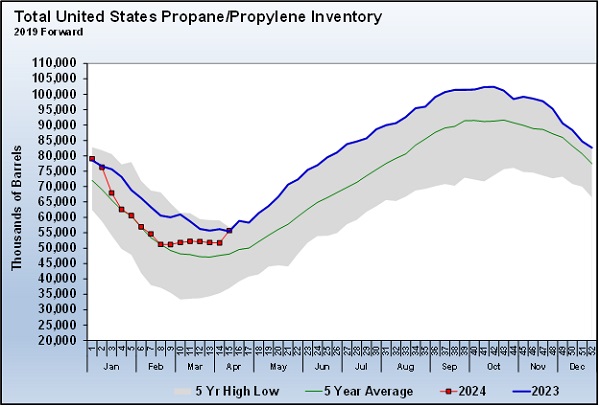
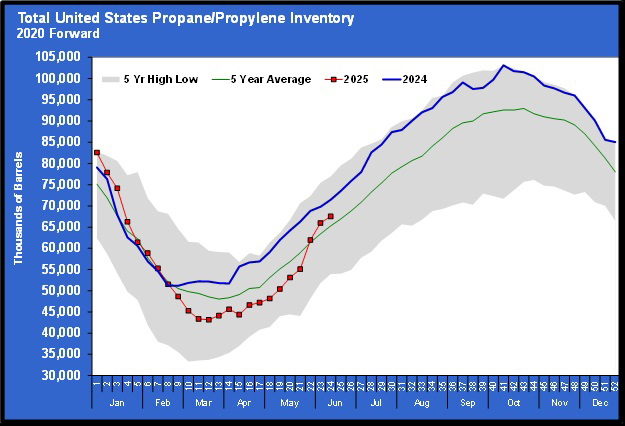
On April 17, the Energy Information Administration (EIA) said in its Weekly Petroleum Status Report that propane inventories increased by nearly 4 million barrels. The 3.989-million-barrel build essentially reset the fundamental trends in propane.
Before that build, propane inventories had experienced a series of small draws in weeks that normally have builds.
After a January winter storm, there was a well-documented drop in inventory back to the five-year average. Then suddenly, in late February, inventories began to rise at a time when they typically decline. The mild weather was generally identified as the cause. Then the modest declines mentioned above began. The big inventory build put levels back on the trend that seemed to be setting up in late February and early March.
To be sure, it has been an atypical inventory trendline since the last week of February. We note that stocks of propane fractionated and ready for sale were first reported at this time. Though we have heard nothing to support it, one can’t help but wonder if there were some errors in the data submitted to the EIA during the early stages of this new process. The inventory in Chart 1 should reflect total propane both fractionated and unfractionated, as it always has. It should not have been impacted by the addition of the ready-for-sale data point.
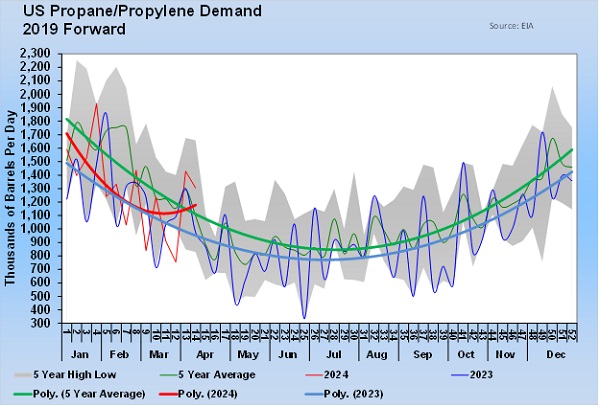
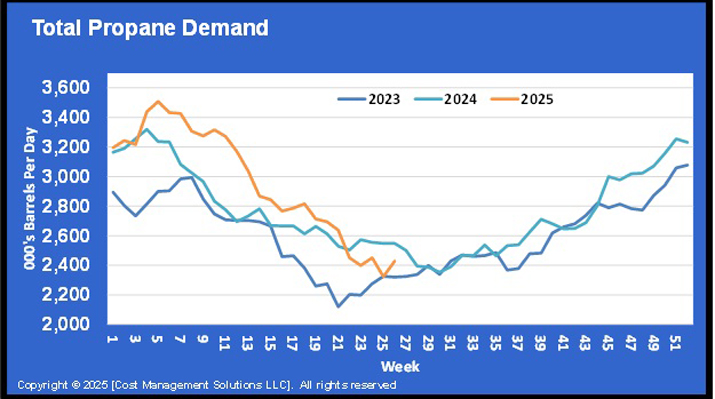
During this same time, domestic propane demand was seeing an atypical pattern as well. Chart 2 is the way the domestic demand chart looked the week before the big inventory build reported this past week.
Note this year’s red trendline and its unusual turn higher that doesn’t seem to match what was going on weather-wise in the U.S. the past few weeks.
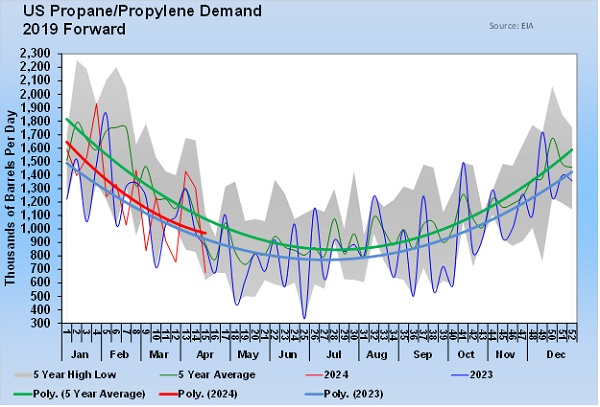
Chart 3 shows what the domestic demand trendline looks like after the 4-million-barrel build in inventory was reported. The same week that big inventory build was reported, propane demand dropped a massive 630,000 barrels per day (bpd). Obviously, this new demand trendline looks much more typical and much more inline with what had been occurring weather-wise.
Remember domestic demand is a calculated number. There are no reports submitted to the EIA on demand. Instead, it uses the reports it gets on inventories, imports, exports and production to determine what domestic demand must be to make the numbers balance. The calculation is basically – if imports, exports and production were X and inventory changed Y, then domestic demand must have been Z. If reports to the EIA on any of the components that are collected are off, then it is going to impact the calculated or implied domestic demand number as well.
Recall that last week’s Trader’s Corner was about May and June generally being good months for hedging activity by buyers since over time those two months have had the lowest prices of the year. But even as we were writing that Trader’s Corner, we were seeing the unusual downtrend in inventories with the series of small draws, knowing that if that trend continued we might not see prices anywhere near the 74-cent level those months have averaged over the past five years.
But with this last big inventory build, the tone of the market has reset. Propane prices have come off notably since that inventory build was reported, with MB ETR settling at 78.75 cents on Thursday and Conway at 75 cents. With this reset, it now looks much more likely that prices could hit their five-year average or go even lower over the next couple of months. That is good news for propane buyers, who might use this period to place hedges for next winter and beyond.
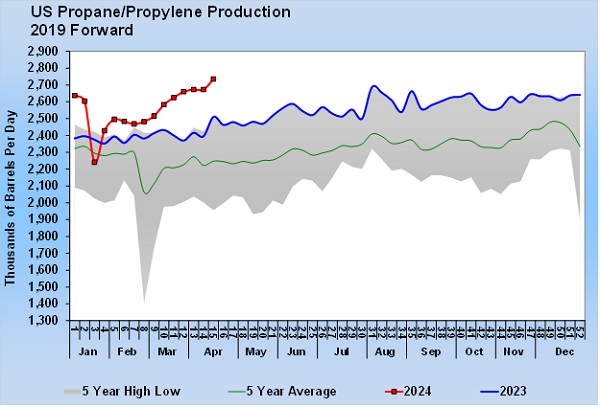
Another important component that increases the odds of favorable propane values going forward is that U.S. propane production just hit a new record.
Propane production hit 2.735 million bpd last week, eclipsing the previous record of 2.687 million bpd set during the week ending Aug. 4 last year. The recent rise in production is certainly a contributing factor to the inventory increases. Propane inventory levels don’t have as much influence on propane production as one might think. Propane production is driven by crude and natural gas production, and it is unlikely any production company is going to cut back on crude and natural gas production just because propane inventories are high. Therefore, the high propane production levels are likely to continue, even though inventories are approaching five-year highs again.
Whether it was simply the rapid increase in propane production over recent weeks or perhaps an inventory adjustment because of the unusual decline in propane inventory, propane valuations have turned in the buyers’ favor in the past few weeks, striking a much more pleasant tone in the market. Buyers just might be whistling a tune and having a skip in their steps over the next couple of months. That certainly would be nice, given the weak demand during the 2023-24 winter took a little out of most retailers’ steps.
All charts courtesy of Cost Management Solutions
Call Cost Management Solutions today for more information about how client services can enhance your business at 888-441-3338 or drop us an email at info@propanecost.com.


