Part III: How US energy has changed since Russia invaded Ukraine
Trader’s Corner, a weekly partnership with Cost Management Solutions, analyzes propane supply and pricing trends. This week, Mark Rachal, director of research and publications, continues his examination of why U.S. energy sources have changed since Russia invaded Ukraine.
It has been two months since Russia invaded Ukraine. In response to the invasion, the U.S. and its allies, especially those in Europe that were dependent on Russia for energy, have been trying to reduce Russian energy imports to punish it for its actions. The U.S. has pledged to help Europe with its energy needs in an effort to supplant Russian energy. We have begun a multipart series on how the U.S. energy data has changed in the months since the invasion.
We listed seven data points we’re going to check to see how the U.S. supply picture is changing to meet its stated goal. Over the last couple of weeks, we have covered three of those points and will continue with the process this week.
In the first week, we covered refinery throughput and refinery capacity, including refinery capacity utilization. The U.S. put an embargo on Russian crude and refined fuels. So far, refinery throughput has not even increased enough to offset the refined fuels that the U.S. is not getting from Russia. This should be one of the easiest areas to address since the available refinery capacity is already in place, yet even here, there seems to be no urgency to replace the Russian refined fuels imports. As a consequence, U.S. refined fuels inventories are declining, helping support higher prices for gasoline and distillates. We have shown that refinery capacity is trending lower. Older refinery capacity is being shuttered and is not being replaced largely due to costs and regulations. No new refinery has been built in the U.S. since the 1970s. All new capacity has come at existing refineries.
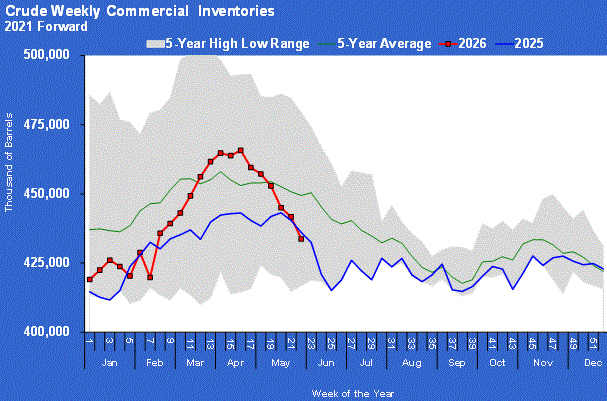
Last week, we focused on crude inventory, breaking the analysis into two parts. The first was the U.S. inventory in the Strategic Petroleum Reserve (SPR) and the second was commercial inventory. After the U.S. draws the current 180 million barrels over the next six months, the SPR will be down near 50 percent from its peak. The fall in the amount of crude in the reserve over the last two years has been alarming.
Commercial inventories are not faring any better. They are setting five-year lows for this time of year and not building as they usually do. That could become more troublesome if inventories draw down over the summer as they usually do during the peak gasoline demand period. As we are about to see, U.S. crude production remains well below where it was before the pandemic, which is limiting the inventory builds.
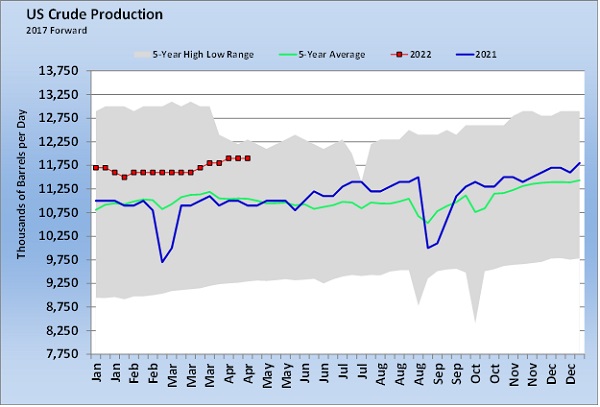
Chart 1: Cost Management Solutions Click to expand.
U.S. crude production is estimated by the Energy Information Administration at 11.9 million barrels per day (bpd). That is an improvement of a million bpd since the same week last year. However, it remains 1.2 million bpd below peak production set in early 2020. In Chart 1, the gray area represents the range between the high and low production levels over the last five years. The big drop-off in production occurred a couple of months after lockdowns caused demand to plummet and has never fully recovered.
Despite the high price of crude, we warned early on that U.S. producers might not raise production very quickly. U.S. producers are in a mode of getting their investors back, and that means paying down debt and returning dividends to stockholders. Despite Europe being desperate for new sources of crude to replace Russian supplies, U.S. producers would take a huge risk upping production without guarantees from European buyers that they would take the increased production. So far, we have not seen any news of such guarantees.
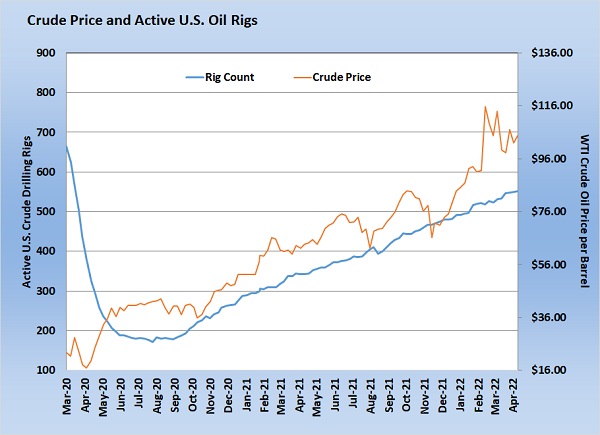
Chart 2: Cost Management Solutions Click to expand.
Raising U.S. production back to at least where it was before the pandemic could be done at a faster rate than what is taking place. But U.S. producers have made it clear they are going to maintain fiscal discipline. That means a more measured approach to capital spending and drilling programs.
Producers have slowly increased drilling for crude as prices have recovered since the collapse right after the pandemic. Currently 552 rigs are drilling for crude in the U.S. That is up 210 since the same week last year. The average weekly rig count was 774 during 2019, building up to peak production in early 2020. Current drilling activity appears enough to maintain production or grow it very slowly.
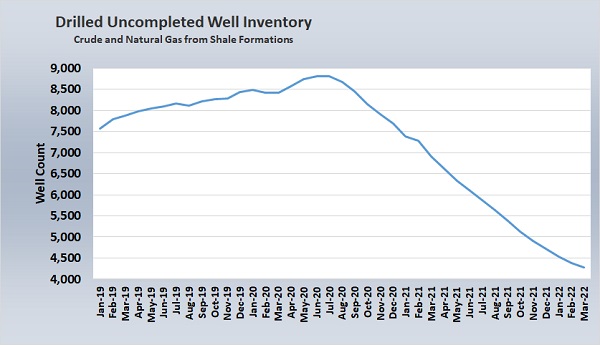
Chart 3: Cost Management Solutions Click to expand.
For years, production companies were drilling wells faster than they could complete them, causing a huge inventory of drilled but uncompleted wells (DUC) to accumulate. Those peaked in June 2020 at 8,816. At the end of March 2022, the DUC inventory was 4,273, down 4,543 from the peak. However, even the rate at which DUCs are being completed has been slowing this year. In 2021, DUC inventory went down an average of 248 per month. In the first three months of this year, it has dropped to 147 per month, and was down to just 114 in March. Again, despite the need to supply Europe, there appears to be no urgency on the part of the U.S. government or industry to provide supply that could help wean Europe off Russian dependency.
Read the rest of the series here:
Call Cost Management Solutions today for more information about how client services can enhance your business at 888-441-3338 or drop us an email at info@propanecost.com.
You May Also Like
-
The US, Iran and propane: A retrospective
Jun 22, 2026 -
Iran peace deal’s impact on propane markets
Jun 15, 2026 -
How the US-Iran war draws on propane inventory
Jun 8, 2026

Subscribe to LP Gas
If you enjoyed this article, subscribe to LP Gas to receive more articles just like it.