How US energy has changed since Russia invaded Ukraine
Trader’s Corner, a weekly partnership with Cost Management Solutions, analyzes propane supply and pricing trends. This week, Mark Rachal, director of research and publications, examines why U.S. energy sources have changed since Russia invaded Ukraine.
It has been two months since Russia invaded Ukraine. In response to the invasion, the U.S. and its allies, especially those in Europe dependent on Russia for energy, have been trying to reduce Russian energy imports to punish it for its actions. The U.S. has pledged to help Europe with its energy needs in an effort to supplant Russian energy.
Early on, the U.S. government put an embargo on the crude and refined fuels from Russia. Just prior to the embargo, the U.S. imported 199,000 barrels per day (bpd) of crude and 473,000 bpd of refined fuels from Russia. Data on U.S. crude import sources lags, so we can’t be sure at this point where the U.S. is getting the crude it once got from Russia. In fact, it may not have replaced it. If it hasn’t, then U.S. crude inventories will be down. The best place to get the crude would be Canada if it is able to supply more.
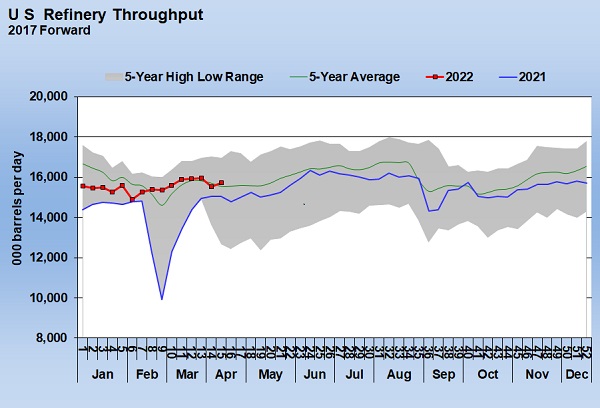
Chart 1: Cost Management Solutions (Click to expand.)
The most logical way to replace the refined fuels coming from Russia is to simply produce more at home. As we pointed out in our March 7 edition of Trader’s Corner, the U.S. has the spare refinery capacity to replace the refined fuels. We also pointed out in that report that the U.S. was a net importer of crude. Just prior to the invasion, the U.S. was importing 6,530,000 bpd of crude and exporting 2,536,000 bpd of crude, making it a net importer of 3,994,000 bpd. The U.S. government made the decision to release a massive amount of crude from the nation’s Strategic Petroleum Reserve over the next six months. The release is the equivalent of one million bpd. That should help reduce U.S. crude imports, leaving more to go to Europe.
Secondly, the U.S. government encouraged U.S. energy companies to produce more oil and gas. But it didn’t do anything to actually help the industry do so. There was no reduction in regulations, reversal on limiting access to federal lands for production or guarantees that the new production would be taken. The only thing that was done was a threat to take away leases that were not being developed. So, the industry is left with simply responding to the possible economic opportunities that higher prices are providing. As we said before, if U.S. producers increase production and suddenly the fighting in Ukraine ends, it is very likely that it goes back to business as usual and Europe will not want the relatively high-priced U.S. crude and natural gas. That would leave U.S. producers exposed to a major price drop.
In any case, if U.S. producers do increase energy production, that should help reduce U.S. crude imports, allowing more to go to Europe. If the increase is enough, it could provide more exports to help supply Europe.
In this Trader’s Corner, we are going to begin looking at some data to see if we can discern any changes in U.S. energy fundamentals that would bring about what we have mentioned above. We have a fairly long list of data points to look at:
- Refinery throughput
- Refinery capacity utilization
- Crude inventory
- Crude production
- Crude imports
- Crude exports
- Drilling activity
We are going to focus on crude. Most of the data for natural gas that would help us evaluate what is going on lags by several months, so we are just going to have to wait on that. However, as we have said, the real issue of natural gas is the limitation on LNG export capacity. The U.S. has pretty much maxed out its current capacity at around 12 billion cu. ft. per day. The only way that could increase is to build more export capacity, and that can take years.
Let’s just start down our list and see what we find. We would expect to find refinery throughput up and refinery capacity utilization higher to offset the lost refined fuels imports from Russia.
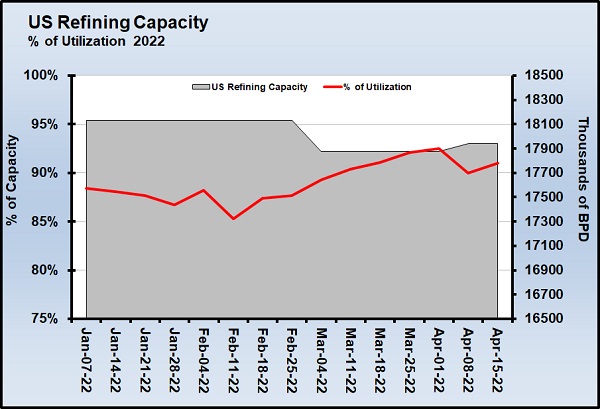
Chart 2: Cost Management Solutions (Click to expand.)
At the end of February, when Russia invaded Ukraine, U.S. refinery throughput was 15.377 million bpd. This past week, it was at 15.717 million bpd. That is an increase of 340,000 bpd. We need to replace 473,000 bpd of Russian refined fuels imports. We are not there, which is applying some of the upward pressure on refined fuels prices. Keep in mind it is a time of year we would be expecting refinery throughput to be rising to build inventory for the summer driving season. We can only conclude that the response so far has been much slower than one might expect given the abrupt halt to the Russian supplies.
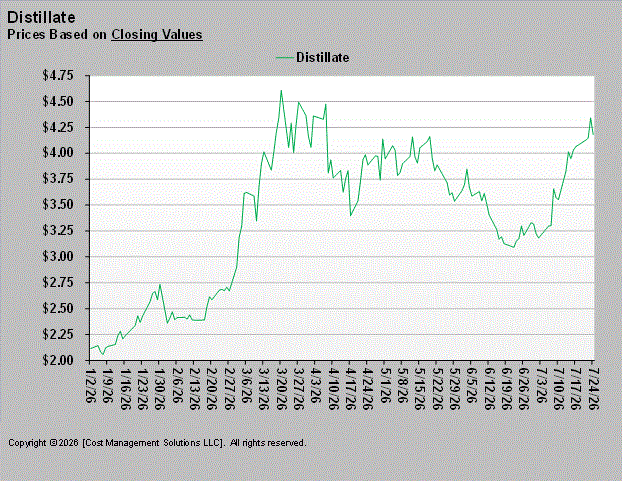
On the day before the invasion, U.S. gasoline at the hub was trading at $2.7253. By March 7, it hit an intraday high of $3.8904. It is now trading at $3.2960. The change is $0.57 per gallon, or 20.94 percent. Distillates/HO priced at $2.3292 at the hub the day before the invasion rose to a high of $4.6709 and now trade at $3.9255. That is a $1.60, 68.53 percent, gain.
In looking at capacity and utilization, we see that our refinery capacity actually dipped right around the time that Russia invaded Ukraine. The utilization rate has gone up from 87.7 percent to 91 percent, but part of that is due to the drop in capacity from 18.132 million bpd to 17.877 million bpd. Capacity has improved the last couple of weeks to 17.941 million bpd. Frankly, we are not sure what caused the drop in capacity at the first of March. The nation’s highest capacity was 18.976 million bpd, but some older refining capacity has been taken offline and not replaced. It’s unfortunate because we could certainly use that capacity now.
Achieving 100 percent utilization is not practical. Over the past 10 years, the average utilization rate has been 88.66 percent, and the max has been 98 percent. The nation could perhaps run at 95 percent capacity for periods, though refinery maintenance would not allow that consistently. At 95 percent utilization, the throughput would be 17.044 million bpd. Last week’s throughput was 15.717 million bpd, leaving 1.327 million bpd of potential additional production.
Hopefully, we will continue to see refinery utilization rates rise to take up some of the slack in capacity. Obviously, we have the capacity to offset all of the lost refined fuels imports from Russia and even produce enough to maybe send refined fuels to Europe. We are not sure of the refined fuels export capacity. We are going to have to do more research on that matter. Last week, the U.S. exported 918,000 bpd of gasoline and about 1.8 million bpd of various distillates. The highest export rate we’ve seen on gasoline has been 1.311 million bpd in December 2018, so it appears there is more that could help Europe on that front. The distillate export rate is closer to the maximum we have seen, so our capacity to do more could be limited.
We will continue down our list next week. It is going to be very interesting to monitor how this data changes as the U.S. tries to help Europe wean itself off Russian energy dependency during the next couple of years.
Read the rest of the series here:
Call Cost Management Solutions today for more information about how client services can enhance your business at 888-441-3338 or drop us an email at info@propanecost.com.
You May Also Like
-
Distillate prices becoming brutal
Jul 27, 2026 -

Aaron Huizenga on the power of self-awareness
Jul 19, 2026 -
Geopolitics send crude and propane prices higher
Jul 13, 2026


Subscribe to LP Gas
If you enjoyed this article, subscribe to LP Gas to receive more articles just like it.