Part V: How US energy has changed since Russia invaded Ukraine
Trader’s Corner, a weekly partnership with Cost Management Solutions, analyzes propane supply and pricing trends. This week, Mark Rachal, director of research and publications, continues his examination of why U.S. energy sources have changed since Russia invaded Ukraine and puts the focus on drilling activity.
It has been two months since Russia invaded Ukraine. In response to the invasion, the U.S. and its allies, especially those in Europe that were dependent on Russia for energy, have been saying they will reduce Russian energy imports as punishment for its actions. The U.S. has pledged to help Europe with its energy needs in an effort to supplant Russian energy. The purpose of this series has been to look at key U.S. data to see if the U.S. energy market is indeed responding in a way that helps the U.S. and its allies wean themselves off of Russian energy supplies. Frankly, the findings to this point have been very disappointing. We have covered refinery throughput, refinery capacity and utilization rate, crude inventory (both commercial and the Strategic Petroleum Reserve or SPR), crude production, imports and exports.
Refinery throughput has increased, but not enough to offset the refined fuels that the U.S. was getting from Russia before the U.S. government put an embargo on those imports. U.S. refining capacity has been trending lower, and that has not changed. Refinery utilization is up slightly since the invasion of Ukraine by Russia, but it is as much a reflection of lost capacity as increased utilization. U.S. crude inventory is not in a healthy position. Commercial stocks are setting five-year lows and not building as they usually do before the summer driving season. Inventory in the SPR has been coming down at an alarming rate over the past two years, and that trend will continue over the next six months as the government makes 180 million barrels available to the commercial market.
Increases in U.S. crude production are necessary to drive most all of the factors we are looking at in a positive direction. However, crude production is struggling to recover from drops that occurred during the pandemic. U.S. production was stuck at 11.6 million barrels per day (bpd) during a seven-week stretch in February and March. Production finally started going up at the end of March, reaching 11.9 million bpd, where it plateaued.
The U.S. has not increased crude imports enough to offset what was lost when an embargo was put on Russian crude. Meanwhile, exports have increased to 675,000 bpd. Between the shortfall in production for our own needs and exports, all of the million bpd being drawn from the SPR is being used without any indication that measures are being taken to significantly increase production by September, when the release of barrels from the SPR is due to end.
This week, we are going to focus on drilling activity. Even though production is well below the peak of 13.1 million bpd, there is the hope that increased drilling will improve the situation between now and September.
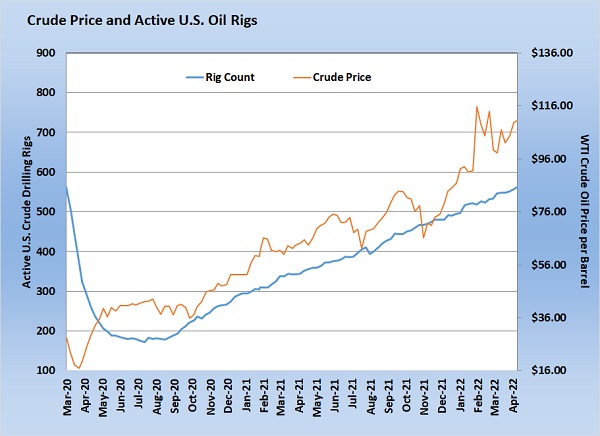
Chart 1 plots the number of rigs actively drilling for crude in the U.S. against the price of crude. The chart covers the time right after drilling activity collapsed as the pandemic began to present. Active crude drilling rig count bottomed at 172 during the week of Aug. 14, 2020. The active rig count is now 563. It has steadily been increasing since the low was set as crude prices rise.
Obviously, it takes time to drill and complete a well, so the impact on production lags by months. Despite the increased drilling, U.S. crude production is still 1.2 million bpd below its peak of 13.1 million bpd. The difficulty in replacing production comes even as producers accelerate the completion of already-drilled wells.
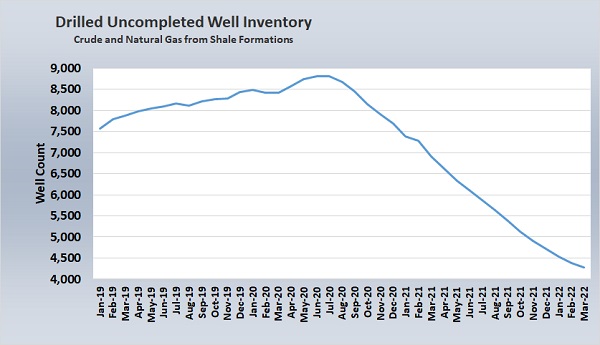
At one point, drilling activity was so strong that wells could not be completed as fast as they were being drilled. An inventory of over 8,800 wells waiting to be completed was built. During the recent period of reduced drilling, the drilled-but-uncompleted well inventory has dropped by more than 4,500 to 4,273. Still, production climbs painfully slow back toward the pre-pandemic peak.
A look at longer-term drilling activity helps explain why.
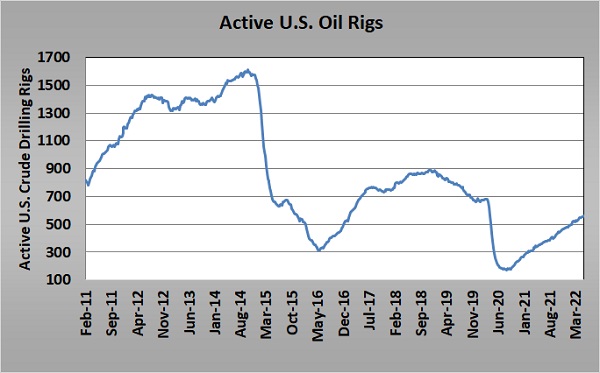
As the long-term drilling rig chart illustrates, there were more than 1,500 rigs active before Saudi Arabia/OPEC tried to break the back of the U.S. energy industry in 2014-15. That effort ended as it was hurting OPEC about as much as it was hurting U.S. production companies as the value of crude plunged. Eventually, crude prices recovered but not without significant long-term damage to the U.S. energy industry.
By 2016, drilling was finally increasing with U.S. companies once again focusing on production rather than profit. The U.S. was maintaining a rig count of between 700 and 900 as it reached its peak production. The focus on production and high capital spending following the “OPEC production flood” of 2014-15 had U.S. companies that were focused on shale production highly leveraged and providing weak returns to stockholders. Then the pandemic hit. The impact was a significant and fundamental change in the U.S. energy industry. Many companies went into bankruptcy and others consolidated. Workers were forced out of the industry. At the same time, the public view of hydrocarbon production became more and more negative as concerns about climate change rapidly increased. This combination of events essentially did to the U.S. energy industry what OPEC had hoped it could accomplish in 2014-15 but came up short.
Keep in mind OPEC was reducing production to make room for U.S. production, which was backward given the U.S. production cost was so much higher. OPEC was the entity balancing supply and demand, trying to keep the price of crude from collapsing again. It should have been the other way around. Low-cost production from traditional producers like OPEC should be the world’s base production, with high-cost production from shale formations filling in any supply deficits. To a large degree, it appears U.S. producers finally accepted that role coming out of the pandemic. Their comments and rhetoric seem to support that view as well. In reality, it is what needed to be done strategically, but it was also necessary to reduce capital spending, allowing them to pay down debt and return more to stockholders. That step was necessary to ensure long-term investment in their businesses and to reopen lines of credit.
One final piece to the puzzle before we draw our conclusions. The depletion rate of wells drilled in shale formations is very high compared to traditional cap and sand formations. It takes a lot of drilling just to replace normal depletion. A lot of the decline in drilled-but-uncompleted well inventory and the increased drilling since the pandemic have simply offset well depletion. Because of so many various inputs and moving parts, it is hard for us to determine what active rig count is necessary to just maintain production at its current level. If we were forced to guess, we would say somewhere around 500. At the current drilling rig count of 563, we should continue to see slow growth in U.S. crude production. We should also see the drilled-but-uncompleted well inventory decline. We would also expect to see the steady increase in drilling activity we have been seeing, but only to a point.
Because of the new focus of U.S. producers to maintain capital discipline, it may take a lot longer than most think to get back to peak production of around 13.1 million bpd. We have read comments from some producers saying they believe the U.S. production estimates by some agencies are too aggressive, too high. That telegraphs they do not plan to go back to the production-at-all-cost strategy that essentially turned the crude market upside down. We think they will accept that large, traditional low-cost producers, such as OPEC, should provide global baseline supply and that high-cost U.S. production should be the swing production that balances global supply with demand. This theory should be tested in the next year or two.
Specific to replacing Russian crude for both the U.S. and Europe as punishment for Russia’s invasion of Ukraine, we do not see U.S. production growing enough over the next six months to offset what is currently being released from strategic reserves. That would mean the U.S. will not be playing a long-term role in helping Europe end its dependency on Russian crude supplies. We are not sure that will even be necessary. There is every indication based on our analysis that world governments expect Russian crude to be producing and flowing to some willing buyer, even as the war in Ukraine rages. Yes, Europe would like to wean itself off of Russian crude as a matter of national security and to avoid the appearance they are supporting Russia’s war. But in the background, we feel confident they will be more than happy for Russian energy to flow to places like China and India, displacing barrels that they can then scoop up from less politically charged producer nations. The alternative is even higher energy costs and a likely collapse of the global economy.
Read the rest of the series here:
Call Cost Management Solutions today for more information about how client services can enhance your business at 888-441-3338 or drop us an email at info@propanecost.com.


