Propane production recovers to near-record levels
Join Cost Management Solutions for a free 30-minute Virtual Hedging webinar on Wednesday, May 29 at 10 a.m. CT. Register here.
Trader’s Corner, a weekly partnership with Cost Management Solutions, analyzes propane supply and pricing trends. This week, Mark Rachal, director of research and publications, looks at recent trends in propane production.
Catch up on last week’s Trader’s Corner here: What in the world? The influence of US propane exports
The winter storm in January had a big impact on propane production. The drop in production caused more calls on inventories, helping to tighten them up and resulting in some support of prices. It has taken a while for production to recover, and this past week it hit the highest level of 2024. The 2.660-million-barrel-per-day (bpd) rate of production was just 27,000 barrels off the record high set in August of last year.
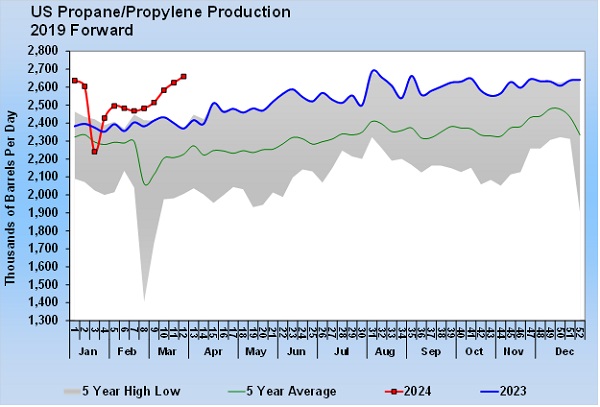
Chart 1: U.S. Propane/Propylene Production 2019 Forward
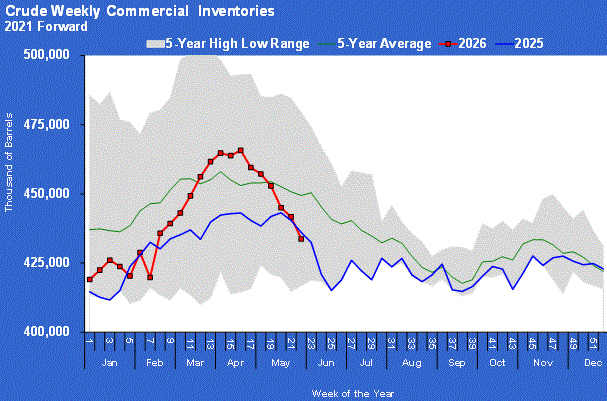
As production has increased over the past few weeks, so have propane inventories.
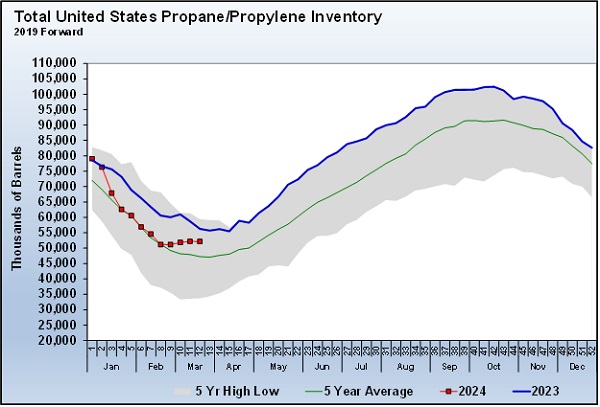
Chart 2: Total U.S. Propane/Propylene Inventory
Chart 2 shows how the call on inventory while production was low caused propane inventories to drop from 2023’s high levels back to the five-year average. But with the recovery in production, it appears inventories are headed back toward the trend seen last year.
After the storm, refinery throughput fell about 13 percent to its lowest point. Some refineries decided to perform seasonal maintenance after the storm rather than start up only to go back down again in a few weeks for maintenance. That extended the time it has taken refinery throughput to get back to normal. It still hasn’t fully recovered.
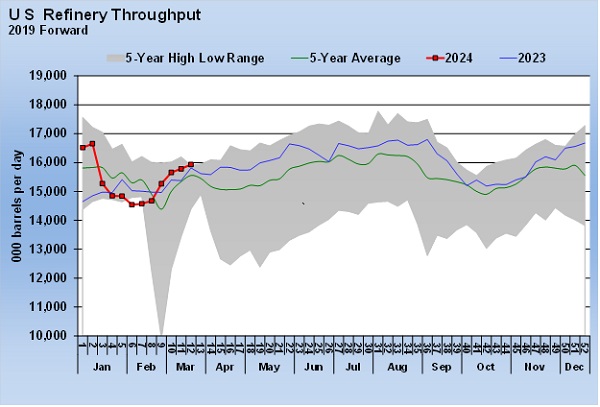
Chart 3: U.S. Refinery Throughput 2019 Forward
There is a strong correlation between the recovery in propane production and the recovery in refinery throughput. However, there simply isn’t any way that the decline in refinery throughput accounted for all the decline in propane production.
Refineries produce about 10 percent of the U.S. supply of propane. Last year, refineries yielded an average of 278,000 bpd of propane. A 13 percent decline in refinery throughput would only yield a 36,000-bpd decline in propane production. Propane production was off 15 percent at its lowest rate, yielding a 396,000-bpd drop.
Refineries also make propylene, and some of that propylene is included in the total propane inventory number reported as 52.164 million barrels for the week ending March 22. And, initially, propylene is included in propane production. But even if we include all the propylene along with the propane produced by refineries, it would only account for 69,000 bpd of the 396,000 bpd of the propane/propylene production drop.
About 90 percent of propane supply comes from natural gas liquids fractionators, so we know that those also had to be running at reduced rates to cause the drop in propane production. Unfortunately, we don’t get any data on fractionator throughput rates. We suspect if we did have the data, the chart would have some semblance to refinery throughput or propane production charts here.
Even though we don’t have data on fractionator throughput rates, this is an example of where the new “ready-for-sale” inventory number from the U.S. Energy Information Administration might help us understand the market better. That number has only been available for four weeks, so it doesn’t help us know what was going on before the winter storm hit. Therefore, it can’t help us analyze the impact of the winter storm on fractionators.
Remember, ready-for-sale propane is that which is downstream of the fractionator and is fungible propane. Over the past four weeks that we have known the ready-for-sale number, it has accounted for about 50 percent of the total propane inventory. The other 50 percent of the propane in the headline number above is upstream of the fractionator, still in a mixture of natural gas liquids called y-grade.
Going back to the winter storm, if fractionators were impacted similarly to refineries, one would expect to see a higher-than-normal drop in propane ready-for-sale inventories. Yes, some of the decline in ready-for-sale inventory could be because the winter storm caused more demand. But if the weather were cold enough in the South, we would probably learn over time by getting the ready-for-sale inventory number that also shows an impact to fractionator output.
Interestingly, the percentage that ready-for-sale propane is of the total inventory number might not change that much in severe winter conditions. Cold weather in the South would also hurt oil and gas production, reducing the amount of y-grade coming into the storage caverns upstream of the fractionator. So, inventories both upstream and downstream of the fractionator could be hurt by the cold weather. Therefore, our best indicator that fractionators are likely being impacted by the cold weather would be an exceptionally large draw in the ready-for-sale inventories.
As we said when we wrote about the new ready-for-sale inventory number, it will take several years covering varying conditions for the number to have a lot of context. But over time, it should help retailers dependent on ready-for-sale propane supplies to better understand where things stand with fractionator operations. Hopefully, this new information, though much of it may be implied, will help us anticipate supply tightness and make adjustments that will improve supply security and better serve our customers.
All charts courtesy of Cost Management Solutions
Call Cost Management Solutions today for more information about how client services can enhance your business at 888-441-3338 or drop us an email at info@propanecost.com.
Related content:
You May Also Like
-
The US, Iran and propane: A retrospective
Jun 22, 2026 -
Iran peace deal’s impact on propane markets
Jun 15, 2026 -
How the US-Iran war draws on propane inventory
Jun 8, 2026

Subscribe to LP Gas
If you enjoyed this article, subscribe to LP Gas to receive more articles just like it.