Speculative propane trading suggests prices could rise
Trader’s Corner, a weekly partnership with Cost Management Solutions, analyzes propane supply and pricing trends. This week, Mark Rachal, director of research and publications, reviews the latest report from the Commodities Futures Trading Commission and what propane industry members need to know.
Catch up on last week’s Trader’s Corner here: What lower crude demand in the US means for propane retailers
The Commodity Futures Trading Commission (CFTC) provides a report each Friday afternoon that shows traders’ positions in various commodities, including propane. We follow data on five commodities for our regular subscribers and clients: crude, gasoline, heating oil, Mont Belvieu propane and Conway propane. Since the CFTC report comes out late on Friday, we include the data in our Monday Propane Price Insider report.
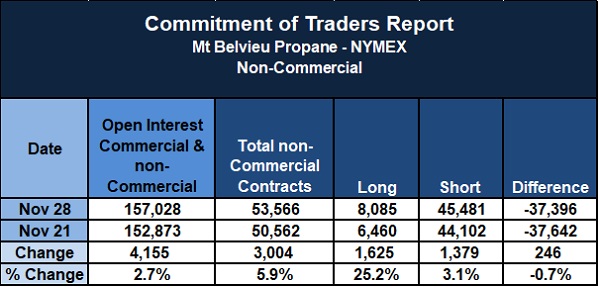
Chart 1: Commitment of Traders Report Nov. 28
We use Chart 1 in that report to provide data for Mont Belvieu propane. This chart shows the weekly change from Nov. 21 to Nov. 28.
Let’s walk through the different columns and discuss what the chart tells us. The first column shows the total number of Mont Belvieu propane contracts by both commercial and non-commercial entities. A contract is 1,000 barrels or 42,000 gallons.
For the week above, 4,155 more contracts were added for a 2.7 percent gain. There were 157,028 contracts in place on Nov. 28. That is a relatively small number of contracts. Gasoline and heating oil have more than 300,000 contracts in play, and crude has more than 1.5 million contracts. Conway propane only had 27,353 contracts in play. The small number of contracts means that propane is rather illiquid compared to other commodities. Liquidity comes from a lot of entities participating in the trade of a commodity.
A lack of liquidity can cause the spread between buyers and sellers to increase, which is a negative for trading. Buyers bid, and sellers offer. The difference between bids and offers is called the bid/offer spread. Because crude is highly liquid, its bid/offer spread is pennies on the barrel. On the other hand, propane is illiquid, and the bid/offer spread is usually around 2 cents on the gallon.
If a trader bought propane at the offer and sold it at the bid a minute later, he would almost certainly lose 2 cents on the trade. The downside is obvious. A trader in the propane market is going to have to see about a 2-cent movement in the market in his favor just to break even. Without speculators in the market, the bid/offer spread could be even wider.
Commercial entities are those that participate in the propane business in some way. If a propane producer held a position, it would be included on the commercial side. The next column shows the contracts for non-commercial entities. Holders of these contracts are not in the propane industry. They just trade the paper in hopes of making a profit. We focus on the speculation positions because speculators only make money by correctly anticipating price direction.
These non-commercial players are likely investment banks and other large financial institutions that have the resources to analyze a market to decide whether to be short or long on a commodity. Seeing where these players place their bets can tell propane retailers a lot about the perception of their commodity by the larger investment community. These folks are not always right, but it is insightful to know how they play the commodity we deal in.
For the week ending Nov. 28, there were 53,566 speculative positions in Mont Belvieu propane, up 3,004 for a 5.9 percent increase. The U.S. produces 2.633 million barrels per day of propane. Speculative traders are holding paper that is the equivalent of just over 20 days of U.S. propane production. Their buying and selling can certainly have an impact on market prices. We have more on that later, but for now, let’s continue learning what we can from the data in the chart.
The next three columns focus on how the speculators are betting on propane prices. The long column is the number of long positions. Those are the speculators that bet prices will go higher. Next is the number of short positions held by speculators that bet prices will go lower. The final column is the difference between the two, also known as the net position.
There were only 8,085 long positions compared to 45,481 short positions for a net short of 37,396 contracts. Most speculators are betting on lower Mont Belvieu propane prices.
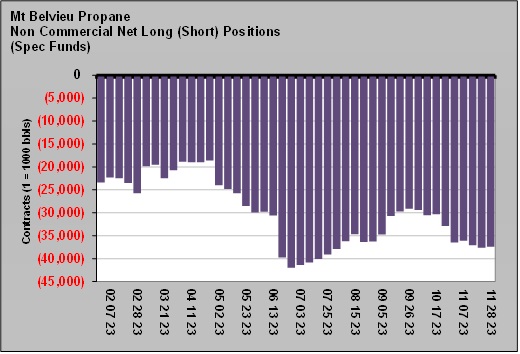
Chart 2: Mont Belvieu Propane Nov. 28
This is not a new development. Chart 2 provides a several-month history of the net position. Speculators have been net-short Mont Belvieu propane since February 2021.
This depicts a negative, or bearish, view of Mont Belvieu propane prices. Chart 2 is a good way to see speculators’ views of how propane prices are likely to change. From July to September, the net short position declined. That could have meant that during that time, speculators believed prices would start increasing, which was negative for their positions, so they started closing them. Since September, the net short position has been growing again. The mild start to winter and the high propane inventory position had speculators adding bets that prices will go lower.
But we must keep in mind another potential impact of the net-short position. We need to understand the action necessary for a trader long or short a position to close that position. When traders are short a commodity, they must buy an offsetting position to close it. When traders short begin to buy to close their positions, they have the impact of putting upward pressure on prices. Traders must sell to close long positions. Doing so can add downward pricing pressure.
In Chart 2, imagine looping a rubber band over the zero at the top, above one of the purple bars, and stretching it to hook at the bottom of a bar. The farther the rubber band is stretched, the more kinetic energy is stored. Similarly, the greater the net short position, the greater the potential buying pressure.
Occasionally, we talk about a short covering rally. Sometimes, traders short will wait late into the month to close positions that are expiring that month. Their buying to close will cause upward pressure on prices for a few days. In those cases, nothing fundamentally changed about the market, yet prices move higher simply from traders short closing positions. Prices generally retreat at the beginning of the new month.
There can also be general rallies caused by a change in fundamentals that are more supportive of a commodity’s price. When speculators believe propane prices have reached their bottom, the resulting buys will add upward pricing pressure until the “kinetic” energy is released. In other words, the number of short positions is reduced.
We chose this topic this week based on market talk that traders short Mont Belvieu propane were in the market covering, which caused the jump in propane prices.
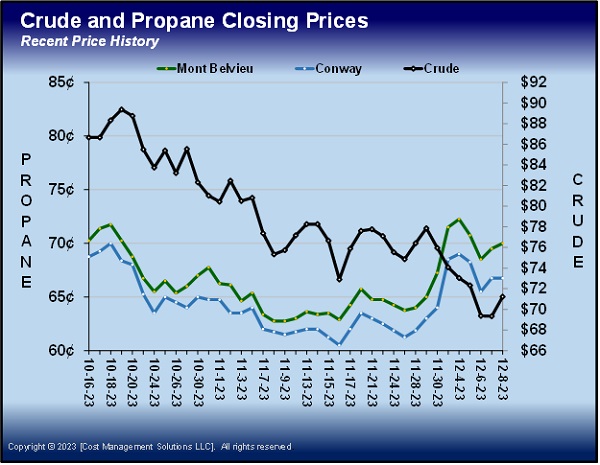
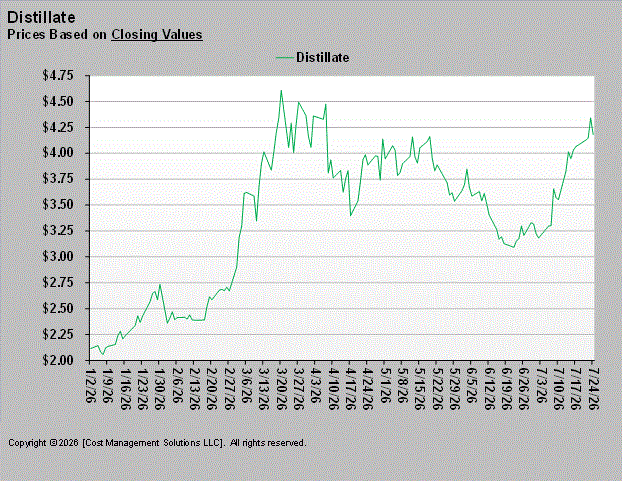
Chart 3: Crude and Propane Closing Prices
You can see the sudden jump in propane prices at the end of November, which, when it started, we considered just an end-of-month short covering bounce as we discussed above. But then the strength continued into December, and the talk of short covering continued.
We waited on last week’s data before finishing this report to confirm that short covering was indeed behind the bounce. The data confirms that it was. We are now adding the CFTC data that was collected on Dec. 5 and released on Dec. 8. This will allow us to compare the week-to-week change.
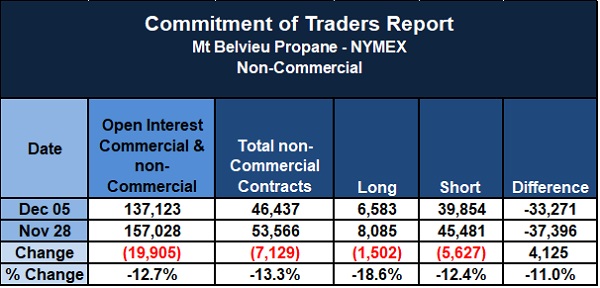
Chart 4: Commitment of Traders Report Dec. 5
Both commercial and non-commercial players reduced positions by 19,905 contracts. Speculative traders accounted for 7,129 of those contracts. Most of the contracts closed by speculators were in short positions. Short contracts closed were 5,627. So those betting on lower propane prices for some reason decided to end that bet.
In the middle of this past week, it looked like the short covering had played out, with prices retreating and giving up some of the recent gain. But then prices rose again to close out the week.
We are not sure what prompted these speculative traders to close more than 12 percent of the short positions in play at this point. Maybe it will be just a short-term anomaly, and prices will fade again in the coming days. But it will behoove us to see if this develops into a trend. Perhaps this occurred because traders want to book profits on these short positions to post them for this year’s earnings reports. Perhaps traders see propane fundamentals getting tighter for some reason.
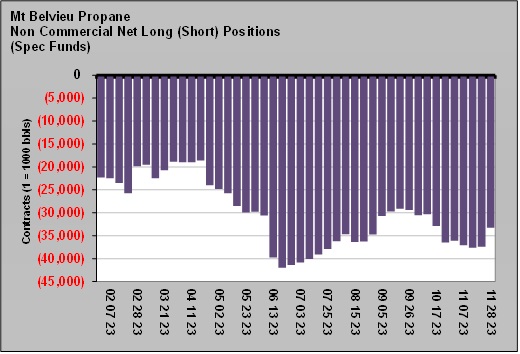
Chart 5: Mont Belvieu Propane Dec. 5
To be sure, those of us earning or living in the propane business in some shape or form will want to watch the purple bars in Chart 5 to see if they keep getting shorter in the coming weeks. If they do, it could be an indication that the traders and analysts who had been speculating that propane prices would go lower are no longer convinced they will.
All charts courtesy of Cost Management Solutions.
Call Cost Management Solutions today for more information about how client services can enhance your business at 888-441-3338 or drop us an email at info@propanecost.com.
Related content:
You May Also Like
-
Distillate prices becoming brutal
Jul 27, 2026 -
Aaron Huizenga on the power of self-awareness
Jul 19, 2026 -
Geopolitics send crude and propane prices higher
Jul 13, 2026


Subscribe to LP Gas
If you enjoyed this article, subscribe to LP Gas to receive more articles just like it.