Part II: Evaluating the state of crude prices
Trader’s Corner, a weekly partnership with Cost Management Solutions, analyzes propane supply and pricing trends. This week, Mark Rachal, director of research and publications, evaluates the current state of crude prices through 2024.
Catch up on this Trader’s Corner series here:
- Part I: Evaluating the state of crude prices
- Part III: Evaluating the state of crude prices
- Part IV: Evaluating the state of crude prices
Our last Trader’s Corner (TC) was a look at the state of crude markets. We decided to expand on that topic for this TC since it is so important to retailers considering hedges for the upcoming winter. We stated in the last TC, which we wrote on July 7, that we thought there was more upside risk than downside risk for crude prices. Crude was amid a good rally that had begun on June 28. That rally continued through July 13. West Texas Intermediate (WTI) closed at $67.70 on the day before the current rally started, and it closed at $76.89 on July 13. That is a gain of $9.19 per barrel, a 14 percent rally.
But our article wasn’t really about a short-term rally. It was more about laying the framework for the possibility of crude prices being higher through the end of the year and into 2024.
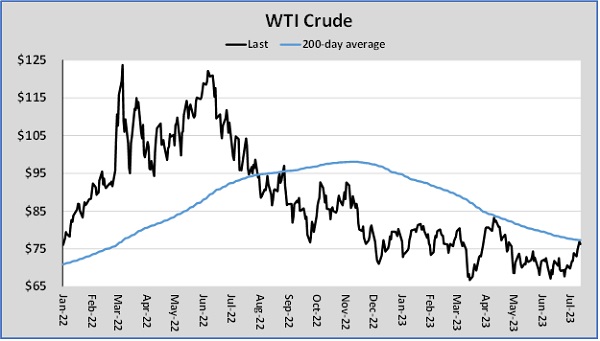
Chart 1 plots WTI closing prices against the 200-day moving price average. The 200-day moving price average is considered the demarcation line between a bull and bear market. After a long bull market run, WTI fell below its 200-day average in August 2022 and has been in a bear market trend since. The benchmark U.S. crude took a strong run at its 200-day average in April after more OPEC+ production cuts were announced. When it failed to break out of the bear trend, a strong sell-off occurred.
WTI is now testing its 200-day moving average as a resistance point again. Many technical traders will sell positions to take profits, which will take a lot of the fuel out of the crude rally and possibly leave this rally to the same fate as the April rally. But in our view, there are reasons to believe that WTI will break through the resistance this time around.
First is the simple fact that the 200-day average has been falling, so it is a lower hurdle to clear. In April, it was at $83.73, and now, it’s at $77.32. And of course, being a long-term average, it is going to continue to fall for a while even if closing prices do go higher.
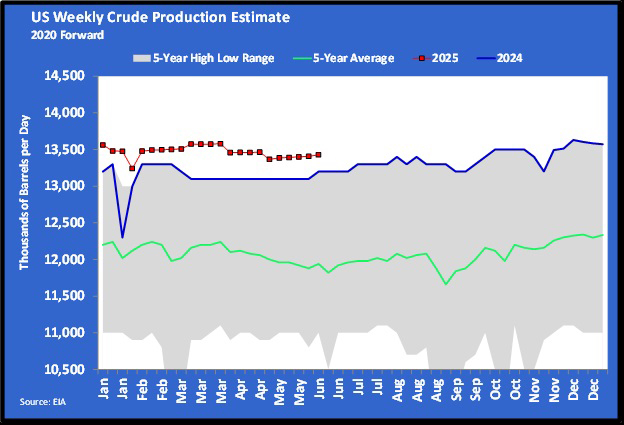
Second is that OPEC+ has done more to limit supply. Saudi Arabia voluntarily cut a million barrels per day (bpd) from its exports in July and announced it will do the same in August. Russia announced it is cutting 500,000 bpd from its exports in August. U.S. production remains very consistent around 12.2 million bpd to 12.4 million bpd. The U.S. Energy Information Administration (EIA) just lowered its average forecasted production rate for this year from 12.61 million bpd to 12.57 million bpd. The EIA may lower it again if producers continue to hold the line on drilling. U.S. producers are employing about 50 fewer rigs drilling for crude than at this time last year.
But our key reason to believe crude could move into bull market territory are the changes in the economic situation. There were good reports on inflation at both the consumer and producer levels this week. Consumer prices were up 0.2 percent in June, the lowest monthly gain in two years. Inflation was 3 percent on an annualized basis, down from 4 percent in May. Core inflation that excludes energy and food didn’t fare as well but was still lower. The core annualized rate was 5 percent, down from 5.3 percent. The Bureau of Labor Statistics released the Producer Price Index (PPI) on July 13. The PPI was up 0.1 percent between May and June. May showed a decrease of 0.4 percent. Expectations were for a gain of 0.2 percent. The core PPI, excluding food and energy, was also up 0.1 percent. On an annualized basis, the PPI was up 0.1 percent overall and 2.6 percent core (excludes food and energy). A year ago, the increase was 11.2 percent and 6.4 percent, respectively, so the rate of inflation has slowed dramatically.
With this data in hand, markets are now leaning toward the Federal Reserve raising interest rates by 25 basis points at its next meeting. An end to the rate hikes will remove uncertainty from markets. It will then just be a matter of seeing if the landing for the U.S. economy will be soft or hard. If it is soft, and the economy continues to show the resilience it has throughout this interest rate increase cycle, the U.S. economy could power through, helping crude demand both here and around the world.
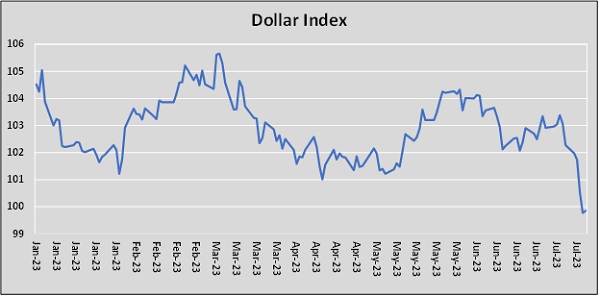
But the improvement in inflation and the potential for the interest rate hikes to end has already had a major impact on something that affects the demand for crude. Crude is traded in U.S. dollars. When the dollar is valued highly relative to other currencies, it hurts the demand for crude in economies that use other currencies. When the value of the dollar goes down, it increases crude demand.
The interest rate hikes by the Federal Reserve had pushed the dollar up to record levels against other currencies. But now that the interest rate hikes are likely to end, the dollar is already falling. In March, the dollar index had soared to 105.674. It ended yesterday at 99.75. The lower dollar is going to increase the demand for crude. Along with the other factors mentioned, it may just be enough to lift WTI into bull market territory. It won’t be easy to break out of the currently long bear market. As we write, crude is selling off on profit-taking after reaching $77.30, right at the $77.32 200-day moving average. But if it happens, there are likely to be more technical buyers of crude. And as we pointed out last week, crude fundamentals are supportive enough to encourage buying as well.
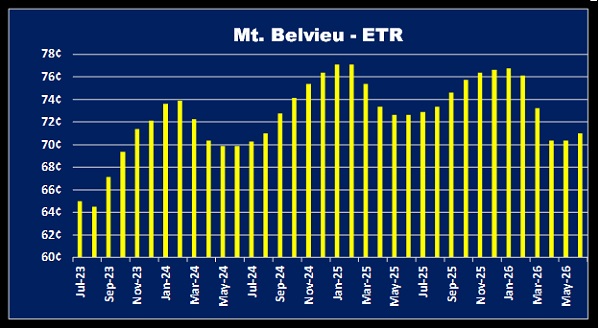
We would not be surprised by $80 WTI soon. We must remember that propane out-month prices are more affected by crude’s price than the current or front month. As crude goes up, we could see more upward pressure on the winter month values than we see in the front month values for propane until the market is convinced the high inventory builds for propane are slowing. We have seen some indication of that in the past couple of weeks as well. Propane is up 10 cents per gallon, or 18.56 percent, since July 3 in the front month and out months have held their premium.
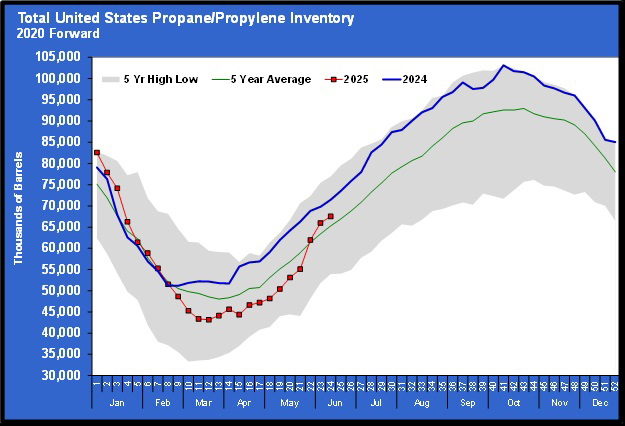
Core winter propane prices for this upcoming year are holding about a 10-cent premium to the front month. That is the same as it was before this latest rally. Propane inventory builds have not been quite as robust over the past four weeks as they were earlier in the summer. Normally, that would cause the front month and out-month prices to come closer together as the front month gains faster than the out months. But in this case, the strong rally in crude has pushed the out-month prices up at the same rate as the front month. Therefore, core winter propane values are up the same 10 cents as the front months.
The growing strength in crude’s price is a threat to propane retailers trying to hedge against higher prices this winter. A failure by crude to break its 200-day average may result in crude prices falling as they did in April after a similar test of the 200-day. But we have made our case as to why it may not play out like that this time around.
Catch up on this Trader’s Corner series here:
- Part I: Evaluating the state of crude prices
- Part III: Evaluating the state of crude prices
- Part IV: Evaluating the state of crude prices
All charts courtesy of Cost Management Solutions.
Call Cost Management Solutions today for more information about how client services can enhance your business at 888-441-3338 or drop us an email at info@propanecost.com.


