Part III: Evaluating the state of crude prices
Trader’s Corner, a weekly partnership with Cost Management Solutions, analyzes propane supply and pricing trends. This week, Mark Rachal, director of research and publications, continues to evaluate the current state of crude prices through 2024.
Catch up on this Trader’s Corner series here:
- Part I: Evaluating the state of crude prices
- Part II: Evaluating the state of crude prices
- Part IV: Evaluating the state of crude prices
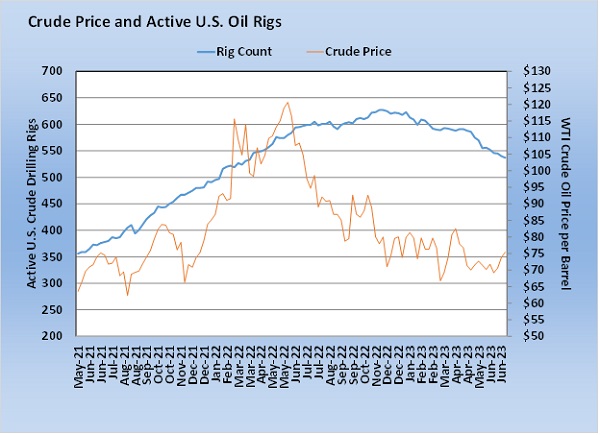
Over the past two weeks, we have focused on the state of crude. We intended to move on to another subject after last week’s installment. However, data came out this past week that may have answered a question we had in the first installment two weeks ago. At that time, we made this statement concerning crude drilling: The bulk of U.S. production is coming from shale formations that have a fast depletion rate. It takes a lot of new drilling to replace depleted wells. We are not sure how many wells would have to be drilled just to maintain production, but we are certainly trending in that direction.
We made that statement because crude producers are employing fewer rigs to drill crude. The latest data for July 14 showed 537 rigs drilling for crude in the U.S. The active rigs dropped by three from the previous week, continuing the downward trend. Producers employed 62 fewer crude rigs last week than during the same week last year.
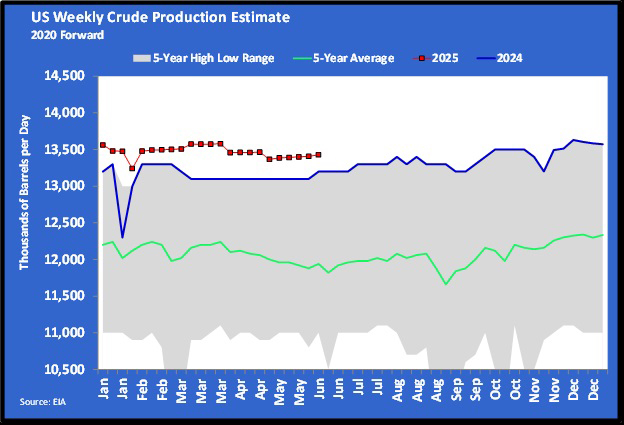
This week, the U.S. Energy Information Administration (EIA) projected crude production from the major U.S. shale plays in August. It projects a decline from 9.42 million barrels per day (bpd) to 9.4 million bpd. The decline is small but significant because it likely tells us what level of drilling it takes just to keep production steady. To put it another way, it could be telling us how much drilling it takes simply to replace depleting wells in shale formations.
Drilling is classified by type: vertical, directional and horizontal. Horizontal drilling is what is done in shale formations and accounts for 90 percent of drilling activity. So, of the 537 active crude rigs, we can assume around 483 are drilling in shale formations. We now can infer that it takes somewhere around that number of active crude drilling rigs in U.S. shale formations simply to maintain crude production. If producers keep drilling activity around this level for a while, and we get a few more months of production data that shows flat to lower crude production from shale formations, we will gain even more confidence in this assumption. But, for us, it at least begins to answer a question that we have long wondered about. It is important to us in evaluating propane supply. Since propane supply (along with natural gas and other NGLs) is mostly coming as associated production from crude wells, this knowledge on drilling activity helps us anticipate the direction of future propane supply.
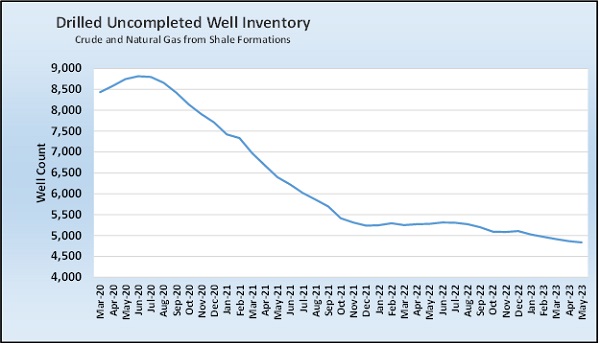
It’s not the whole story on propane supply to be sure. The amount of fractionation capacity and refinery throughput will also have an impact. But it is an important piece of the equation. In responding to the EIA projection, one industry analyst says that lower drilling activity, anemic productivity and reduced drilled but uncompleted wells are all contributing to the decline. We can’t speak to the anemic productivity, but we do keep data on the drilled but uncompleted wells, referred to as DUCs.
The existence of DUCs does make identifying the exact drilling level it takes to maintain crude production more complicated.
When producers had much more robust drilling programs, the inventory of wells that had been drilled but not completed increased. The number in Chart 2 includes both crude and natural gas. Unfortunately, we do not have a breakdown by type, which would be helpful. We can assume that the bulk of the DUCs are crude wells simply based on the ratio of rigs that have been drilling for crude compared to those drilling for natural gas.
Because DUCs exist, their completion does contribute to maintaining U.S. crude production. And since the number of DUCs has been coming down, if they didn’t exist, it would take more drilling to maintain production. But they do exist, and the 4,800-plus in inventory will influence production for a long while. Should the day ever come when this inventory is depleted, we will have to reassess how much drilling it would take to maintain production. But for now, our assumption is that it takes a combination of somewhere between 480 and 490 active drilling rigs and a well completion rate that lowers the inventory of DUCs to maintain crude production from shale formations. We will look for more data in the coming months to confirm this assumption.
We can say without doubt that declining drilling activity has a negative impact on propane supply. We already have seen that happening this year. So far this year, propane production has increased 67,000 bpd over last year. In 2022, when drilling was more robust, propane production averaged 118,000 bpd more than it did in 2021. The growth in propane supply appears to be plateauing.
Production is much less elastic than demand. Winter demand, or increased demand from petrochemicals both here and abroad, could cause an increase in overall demand rather quickly. With the growth in supply slowing, increased demand could result in a call on inventories to keep up. Tightening inventories would then support higher propane prices. Any response to higher demand from the supply side would likely evolve slowly. Remember also that higher propane prices in themselves will not lead to more crude drilling. Drilling is driven by the demand for crude and natural gas, not propane demand.
The bottom line is that slowing U.S. propane production is a threat to propane retailers and consumers in that it constitutes the potential for a higher pricing environment. The drilling and production trends tell us that we need to be prepared for that possibility.
Catch up on this Trader’s Corner series here:
- Part I: Evaluating the state of crude prices
- Part II: Evaluating the state of crude prices
- Part IV: Evaluating the state of crude prices
All charts courtesy of Cost Management Solutions.
Call Cost Management Solutions today for more information about how client services can enhance your business at 888-441-3338 or drop us an email at info@propanecost.com.


