Inventory draws support propane prices
Trader’s Corner, a weekly partnership with Cost Management Solutions, analyzes propane supply and pricing trends. This week, Mark Rachal, director of research and publications, takes a look at the latest inventory draws and the reflected propane prices.
Catch up on last week’s Trader’s Corner here: Part II: Surprising discovery about propane’s monthly average prices
Just three weeks ago, U.S. propane inventory looked like Chart 1.

Chart 1: Total U.S. Propane/Propylene Inventory Through March 10
We wrote that the propane inventory drawdown period usually ends from week nine through week 17 of the year. The average end is week 12. At the time, it certainly looked like the inventory drawdown for 2023 had ended at week nine, the very front of the window. Plus, it looked like the drawdown would end with inventory right at a five-year high for that time of year. That created a bearish environment for propane prices.
However, the inventory drawdown did not end during week nine, and week 10 did not represent the beginning of this year’s inventory build period. Instead, the market has been surprised by two relatively large calls on inventory since week 10. During week 11, inventory fell 2.267 million barrels, and during week 12, it fell 2.460 million barrels. That is a combined 4.727-million-barrel decline in inventory. Chart 2 is what inventory looks like now.
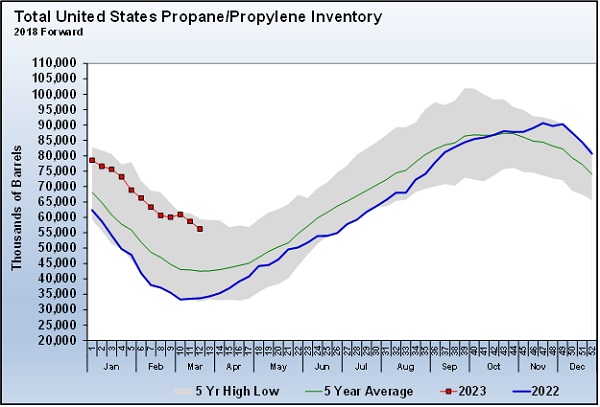
Chart 2: Total U.S. Propane/Propylene Inventory Through March 31
Inventory is still in excellent shape coming out of this winter, but these latest draws do ensure that the inventory drawdown will last until at least week 12, which is the average week that inventories stop drawing down for the year. It’s easy to visualize what the chart might have looked like had the trend that appeared to form in week 10 continued. Inventory would have set a new five-year high for this time of year. Instead, inventory is about 3 million barrels below the current five-year high of 59.424 million barrels set in 2020.
With the growth in crude and natural gas production slowing from last year, so does propane production. So far this year, U.S. propane production is 9,000 barrels per day (bpd) higher than last year. That is a far cry from the 158,000-bpd supply growth seen during the first 12 weeks of last year compared to 2021. Part of the big gain between 2021 and 2022 was that the winter storm in 2021 severely hurt production in February. Still, the leveling out of propane production is obvious.
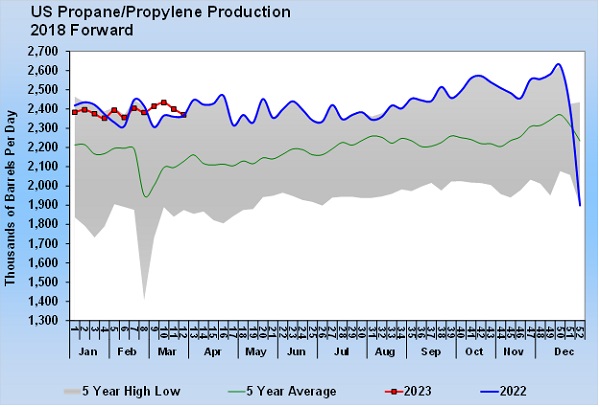
Chart 3: U.S. Propane/Propylene Production
As Chart 3 shows, last week’s production of 2.370 million bpd was just 4,000 bpd more than the same week last year.
Propane inventory is in great shape right now, and production is near record highs even though it is not growing nearly as much as it had been. So all is well unless propane demand increases as supply stays steady.
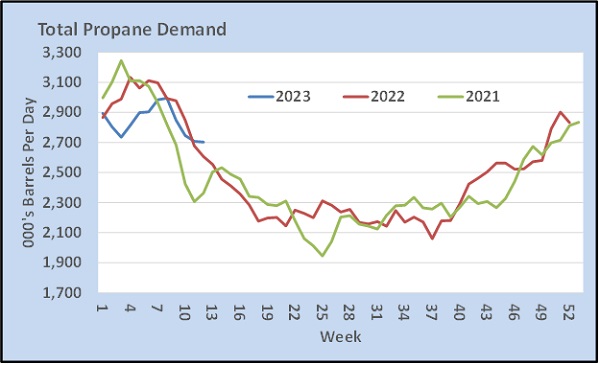
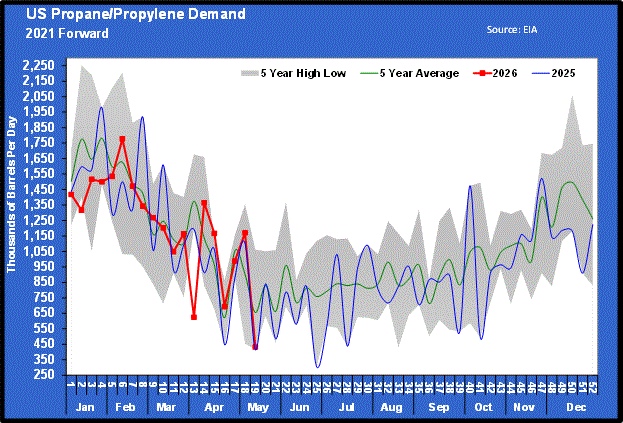
Chart 4: Total Propane Demand
Chart 4 shows combined domestic and export demand for propane by year. Domestic demand during the second half of the 2022-23 winter has been low. In fact, this year’s domestic demand has averaged a remarkable 503,000 bpd below the same period in 2022. It has taken robust export demand that has averaged 427,000 bpd to keep propane from flowing down main street. But, note in Chart 4 that this year’s combined demand is now slightly higher than what it was in 2021 and 2022 for this time of year.
What can keep you up at night is the possibility that domestic demand starts recovering.
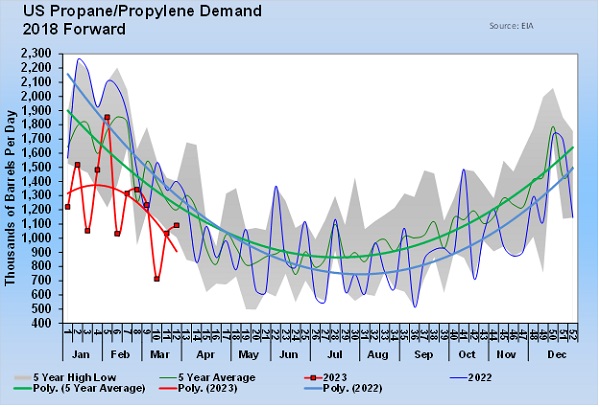
Chart 5: U.S. Propane/Propylene Demand
Chart 5 shows domestic demand. The weekly changes are very choppy, so we have added polynomial trend lines for easier comparison. This year’s domestic demand is obviously very off. Petrochemicals account for some of the lower demand, but there has to be a drop off in retail demand as well. This winter has been comparable to last winter in terms of heating degree-days, so why such a difference in demand? If you read Trader’s Corner regularly, you know we keep asking this question.
Without a clear answer when we note production in Chart 3 and current combined demand in Chart 5, we can’t help but be a little concerned. The steady message you see in the market is that there will be a huge build in propane inventory this summer, and thus the outlook for propane prices is bearish. But when we look at the data, it is hard for us to buy a ticket for that train. Yes, if domestic demand stays low, that train is probably headed to the right destination. However, these charts suggest we may need to switch some tracks to end up at that destination.
All charts courtesy of Cost Management Solutions.
Call Cost Management Solutions today for more information about how client services can enhance your business at 888-441-3338 or drop us an email at info@propanecost.com.
Related content:
You May Also Like
-
Much-needed propane inventory build
May 19, 2026 -
Aaron Huizenga on getting the most out of meetings
May 16, 2026 -
Propane prices remain stable, relatively cheap
May 11, 2026 -

M&A momentum continues across the propane industry
May 11, 2026

Subscribe to LP Gas
If you enjoyed this article, subscribe to LP Gas to receive more articles just like it.